The Token Curve
Financing terms will set the cost floor for every token served, and I believe heterogeneous compute will materially reprice the long-contracted GPU market.
Previously, I wrote about GPU financing, debt markets, and how software fungibility can make compute liquidity broader and increasingly cross-vendor over time. I wrote that essay and this one at the same time, then split them so each could make a cleaner point - and kept this one shorter. Here, I focus on what I call “The Token Curve” - how heterogeneous compute is going to reshape and reprice the market for long-term GPU commitments.
The core argument is that portability does not create heterogeneous compute - rather, it turns the heterogeneous capacity that already exists into supply the market can actually use. Once enough of that capacity is production-ready and available at meaningful scale, I believe it will reset the marginal cost of inference and reprice fixed GPU commitments.
In this essay, I consider “demand” as having three different measurements, and they’re growing at different rates:
Usage volume - tokens actually served - is compounding at something absurd, on one of the fastest adoption curves the industry has recorded.
Inference revenue - the product of rapidly rising volume and rapidly falling realized prices, so it can grow much more slowly than token volume.
Infrastructure investment - capex - is neither of these; it’s a forward capital commitment against forecasts of both.
Visually you can think of this looking something like this:
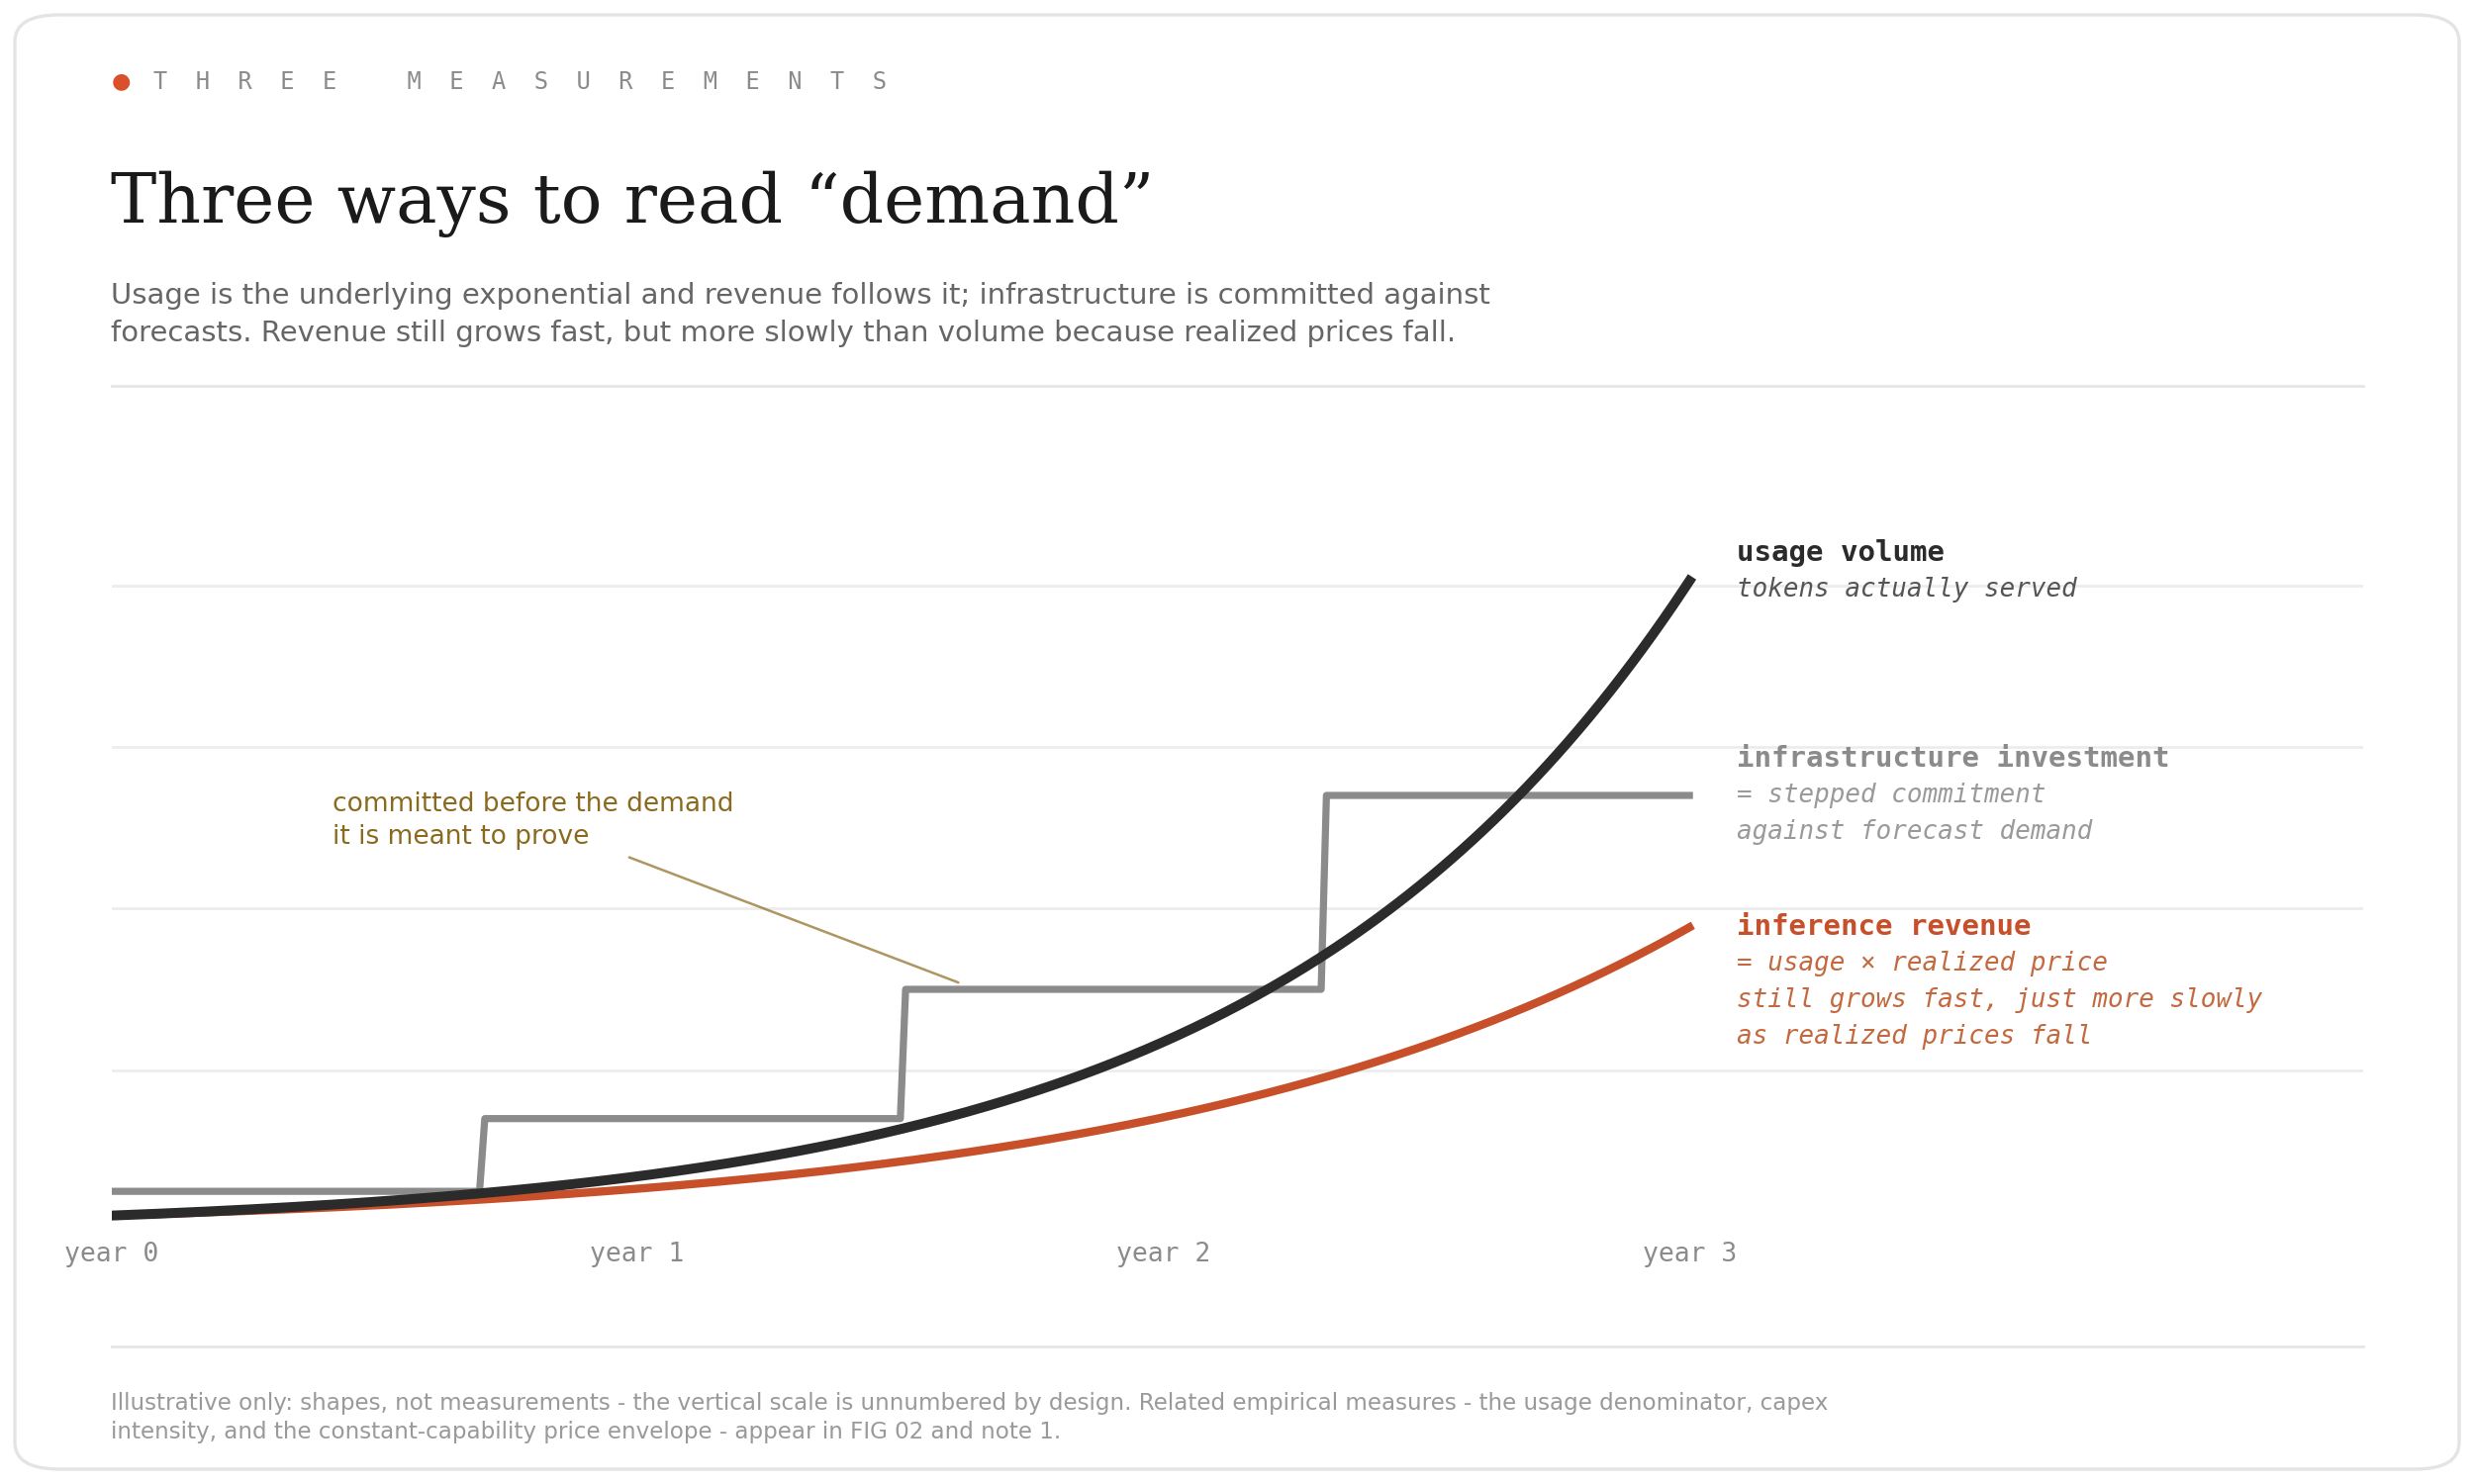
FIG. 0 This is just an illustration of three ways to read demand, as illustrative shapes rather than data: usage volume compounding fastest; inference revenue as volume x falling prices; infrastructure investment in step functions committed ahead of both. A more measured versions appears in FIG 01 and note 1.
When I hear people say “demand isn’t slowing,” I think they’re usually pointing at capex, which in my view is the least direct and most forward-looking proxy of the three - it measures capital committed against expected demand rather than consumption itself, even when much of that spending is already supported by customer contracts. Instead, I wanted to focus on the gap between the second and third measurements - the distance between the inference revenue actually arriving and the capital being committed against it - a gap that I noticed the Bank for International Settlements (and I’m sure many others) has begun measuring versions of this directly (which my first essay walks through on the credit side).[1] That financing gap sets up the token curve, as I use it: the relationship between two curves this essay will separate - the market price of fixed-capability inference and the portable break-even cost of producing it - and the basis between them - asking, what will a token of a given capability cost to produce next quarter, next year, and the year after? Think of it as the forward-looking cost of producing the same unit of intelligence.
One practical thing I’ve learned is that financing terms do not set the market price of a token - competition does. By this I mean that an operator’s required cost floor can be mapped in a simple equation: required token cost = (capital recovery + power + operations) ÷ effective tokens produced. With token cost defined this way, we can watch how each variable moves the equation over time.
Interestingly, this also tells us that falling unit prices can coexist with massive revenue when volume scales up - the risk being priced becomes the unhedged mismatch between a fixed cost line and a repricing revenue line. To make it simple, I just use the standard industry language - dollars per million tokens - and then try to understand what a “collapse” looks like. Using public data, a clear example is that Alphabet’s capex intensity per token served has fallen almost ninety-fold in two years, and the only way that happens while capex nearly quadruples is because the underlying demand denominator grew 330x in the same period.
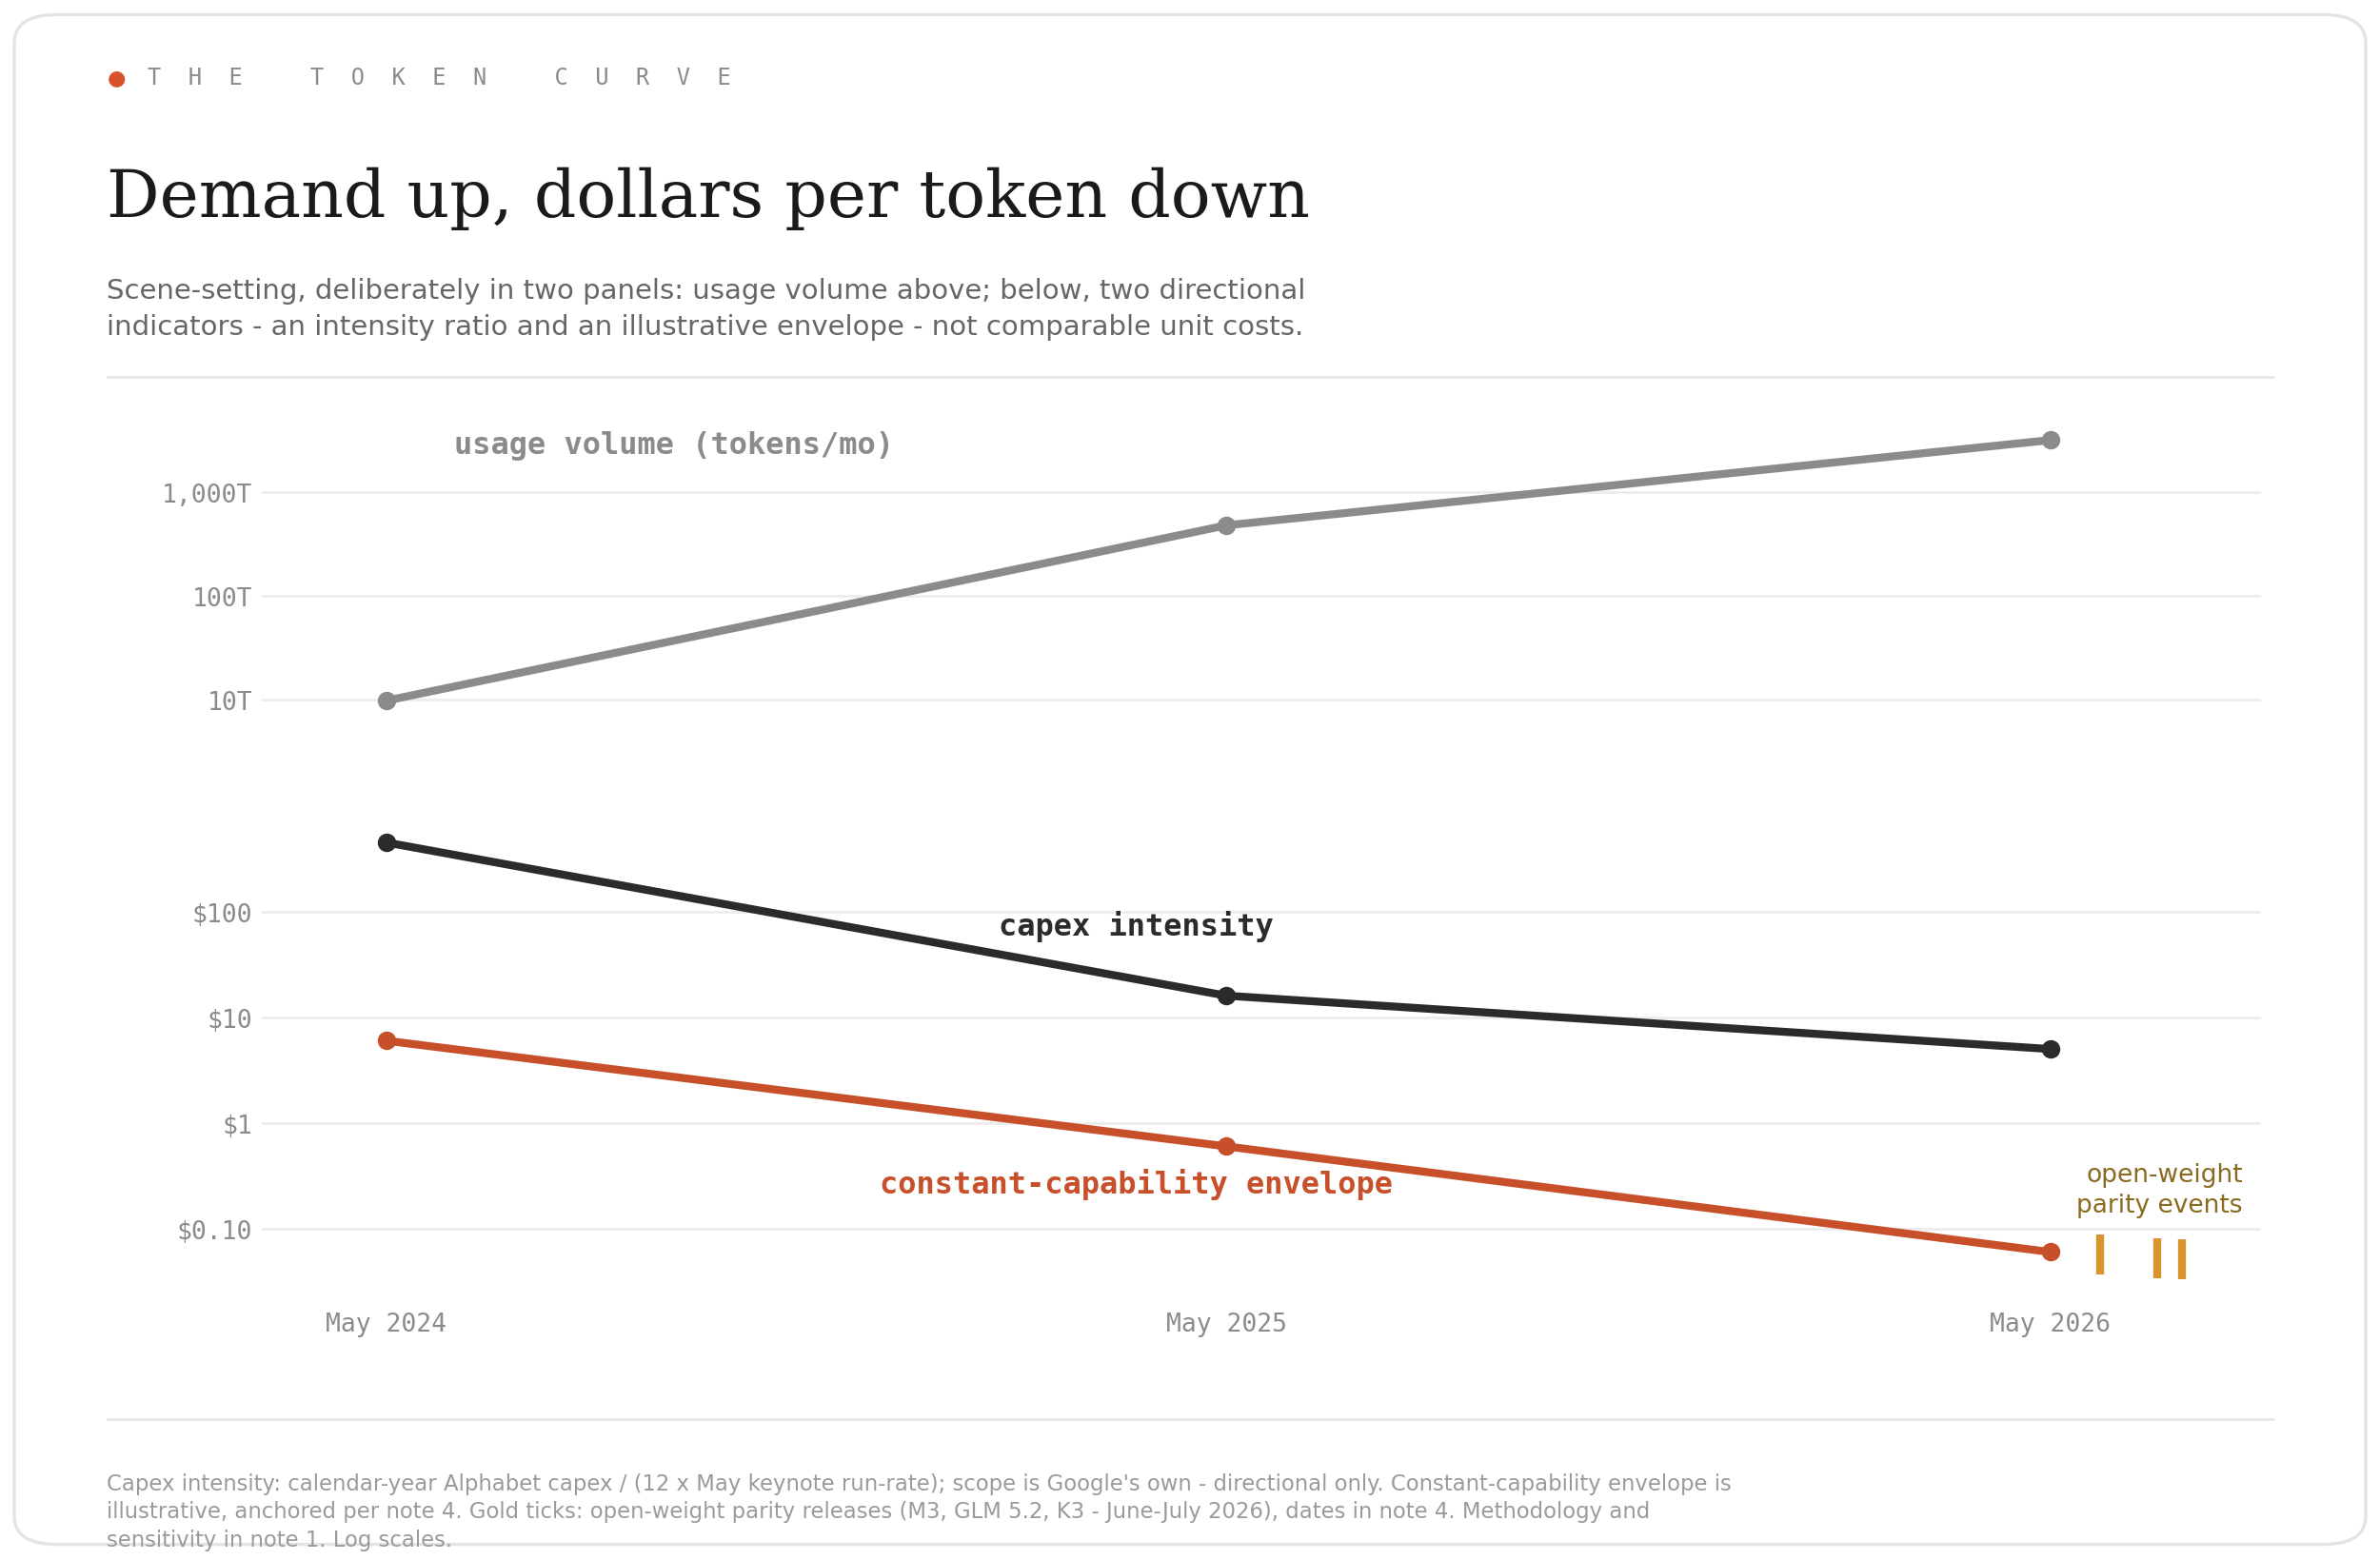
FIG. 01 Scene-setting in two panels on a log-scale: usage volume above; below, two directional indicators - Alphabet capex intensity (a ratio) and an illustrative constant-capability envelope, with mid-2026 open-weight parity releases ticked - not comparable unit costs. Methodology in note 1; envelope construction and parity dates in note 4. Lower-panel series share the dollar axis for direction, not level.
The math behind the above chart is pretty simple, using a log scale - the demand line is Sundar’s own numbers from three successive I/O keynotes: Google served 9.7 trillion tokens a month in May 2024, roughly 480 trillion in May 2025, and over 3.2 quadrillion in May 2026. The capex line comes from Alphabet’s filings: $52.5 billion in 2024, $91.4 billion in 2025, and a 2026 guidance range of $195 to $205 billion, of which I use the $200 billion midpoint. Divide each year’s capex by that year’s May token run-rate annualized - $52.5 billion over roughly 116 trillion tokens, $91.4 billion over 5,760 trillion, $200 billion over 38,400 trillion - and you get roughly $451, $16, and $5 of capex per million tokens served. The market-price line is what I’m calling the “constant-capability envelope”: an illustrative price path for a fixed reference task at a defined quality threshold - a constant-capability API-price envelope rather than a measured “task-cost” index. An actual basis contract would translate both revenue and serving cost into dollars per standardized task using a fixed input, output and caching profile. I anchor it at GPT-4-class output, roughly $60 per million tokens in March 2023, falling about 10x per year since - the same slope a16z documents for GPT-3-class output from 2021, with task-level rates varying 9x to 900x per Epoch.
Every later model example in this essay is an observation within this envelope and I will keep referring back to it throughout. Some caveats in the data I have access to are that capex is an intensity ratio, not a unit cost, reflecting that it is spent ahead of usage. It also includes both training and infrastructure that never actually serves a token and I would also note that Google’s token count spans every surface it runs - so not just just paid inference as another qualifier. The two series on the chart are therefore not directly comparable unit costs - my point is that the figure demonstrates the demand denominator and the direction of market pricing, not Google’s inference economics. I don’t believe any of these caveats change the underlying thesis however. I want to also make it clear that there are two different curves in play - the market curve and the portable cost curve:
The market token curve is the price of completing a standardized task, regardless of which model does it - open-model competition moves this the most.
The portable cost curve is the break-even cost of running a fixed checkpoint at a defined fidelity and service level across whatever qualified hardware is cheapest - and it’s my view that silicon portability moves that one.
We can test whether the same model behaves consistently across different hardware, but comparing different models requires judging whether they can perform the same task at the same quality. For any provider, the Token Curve is the gap between what the market will pay and what it costs them to produce that work.
If we combine the learnings around how the debt behind the AI buildout is actually priced, with the uncertain signals that lenders are providing in underwriting the silicon - then this essay is meant to map that uncertainty back on the actual dollar per token value over time, which is fundamentally what everyone is trying to understand long term.
The token sandwich
Let’s try to understand the math behind the price of a token.
To start, consider that a datacenter operator’s GPU-hour rate has to recover its capital inside whatever window the lender allows, plus the spread the lender charges: that is, when loans fully amortize in under five years, that entire recovery is compressed into 36 to 60 months of rentals. Not every company borrows money to buy its GPUs, and hyperscalers often pay for them with their own cash, but the economics are still similar: the company decides how many years the GPUs have to earn back their cost and what return the investment must produce. For a borrower, a lender sets that window, but for a cash-funded deployment, the company’s own financial modeling has to set it. Either way, the reality is that the hardware has a limited period in which it must pay for itself. We know this from the prior essay where CoreWeave takes roughly 26 cents of interest expense per revenue dollar - a company-level ratio rather than a literal per-token charge, but financing expense is ultimately recovered through fleet economics. Thats to say that it feeds the cost floor under every hour its GPUs rent, and every token served.[2] In CoreWeaves case, this burden persisted into the second quarter: $640 million of net interest on $2.575 billion of revenue - roughly 25 cents per dollar - alongside $1.393 billion of depreciation and amortization, which is most of the distance between its 59% adjusted EBITDA margin and its 5% adjusted operating margin (note 2). So its clear that financing and capital recovery sit underneath literally every GPU-hour.
But the real question is who is buying those hours? We can’t think of it as purely GPU hours, as the currency of AI is tokens and increasingly everyone wants to sell tokens, not GPU hours because of the higher margin. So in this regard, downstream of the datacenter operators sits a layer of inference providers - many of whom remain economically and operationally anchored to CUDA and NVIDIA capacity, even when they have begun adding AMD or multi-cloud support - and a common operating model is to procure compute on multi-year reserved compute cycles and sell it back to the world by the token.[3] For existing inference providers, the way to think about the trade they are making is that they are “long” a fixed capacity (despite being exposed to market repricing), and “long” their own efficiency roadmap.
Practically, that looks like locking in three years of Hopper or Blackwell at today’s reserved rate: cost of goods fixed on NVIDIA’s release schedule, while revenue is repricing at the market rate. The challenge here is that the market schedule is brutal - the price of constant-capability inference has fallen at something like 10x per year (on the assumptions I use) - my envelope anchors at GPT-4-class output from March 2023, and a16z documents the same slope for GPT-3-class output from 2021, a thousand-fold in three years - with task-level declines ranging from 9x to 900x annually - against the roughly 23% yearly decay in the GPU-hour itself.[4] So the argument doesn’t depend on some crazy steep and negative reading - the chart below is a 2023-2026 model I created with Claude. It holds a locked contract flat and divides it by the provider’s own efficiency roadmap - effective cost per task is the contracted GPU-hour divided by tasks per GPU-hour. As you can see, even 2x-a-year serving gains leave a locked contract indexed at 12.5 against a market band of 0.1 to 3.7, and repricing onto new contracts narrows but does not close the gap against a 3x market. The “sandwich” gap closes only when the efficiency roadmap exceeds the market curve, which is precisely what I'm trying to describe below.
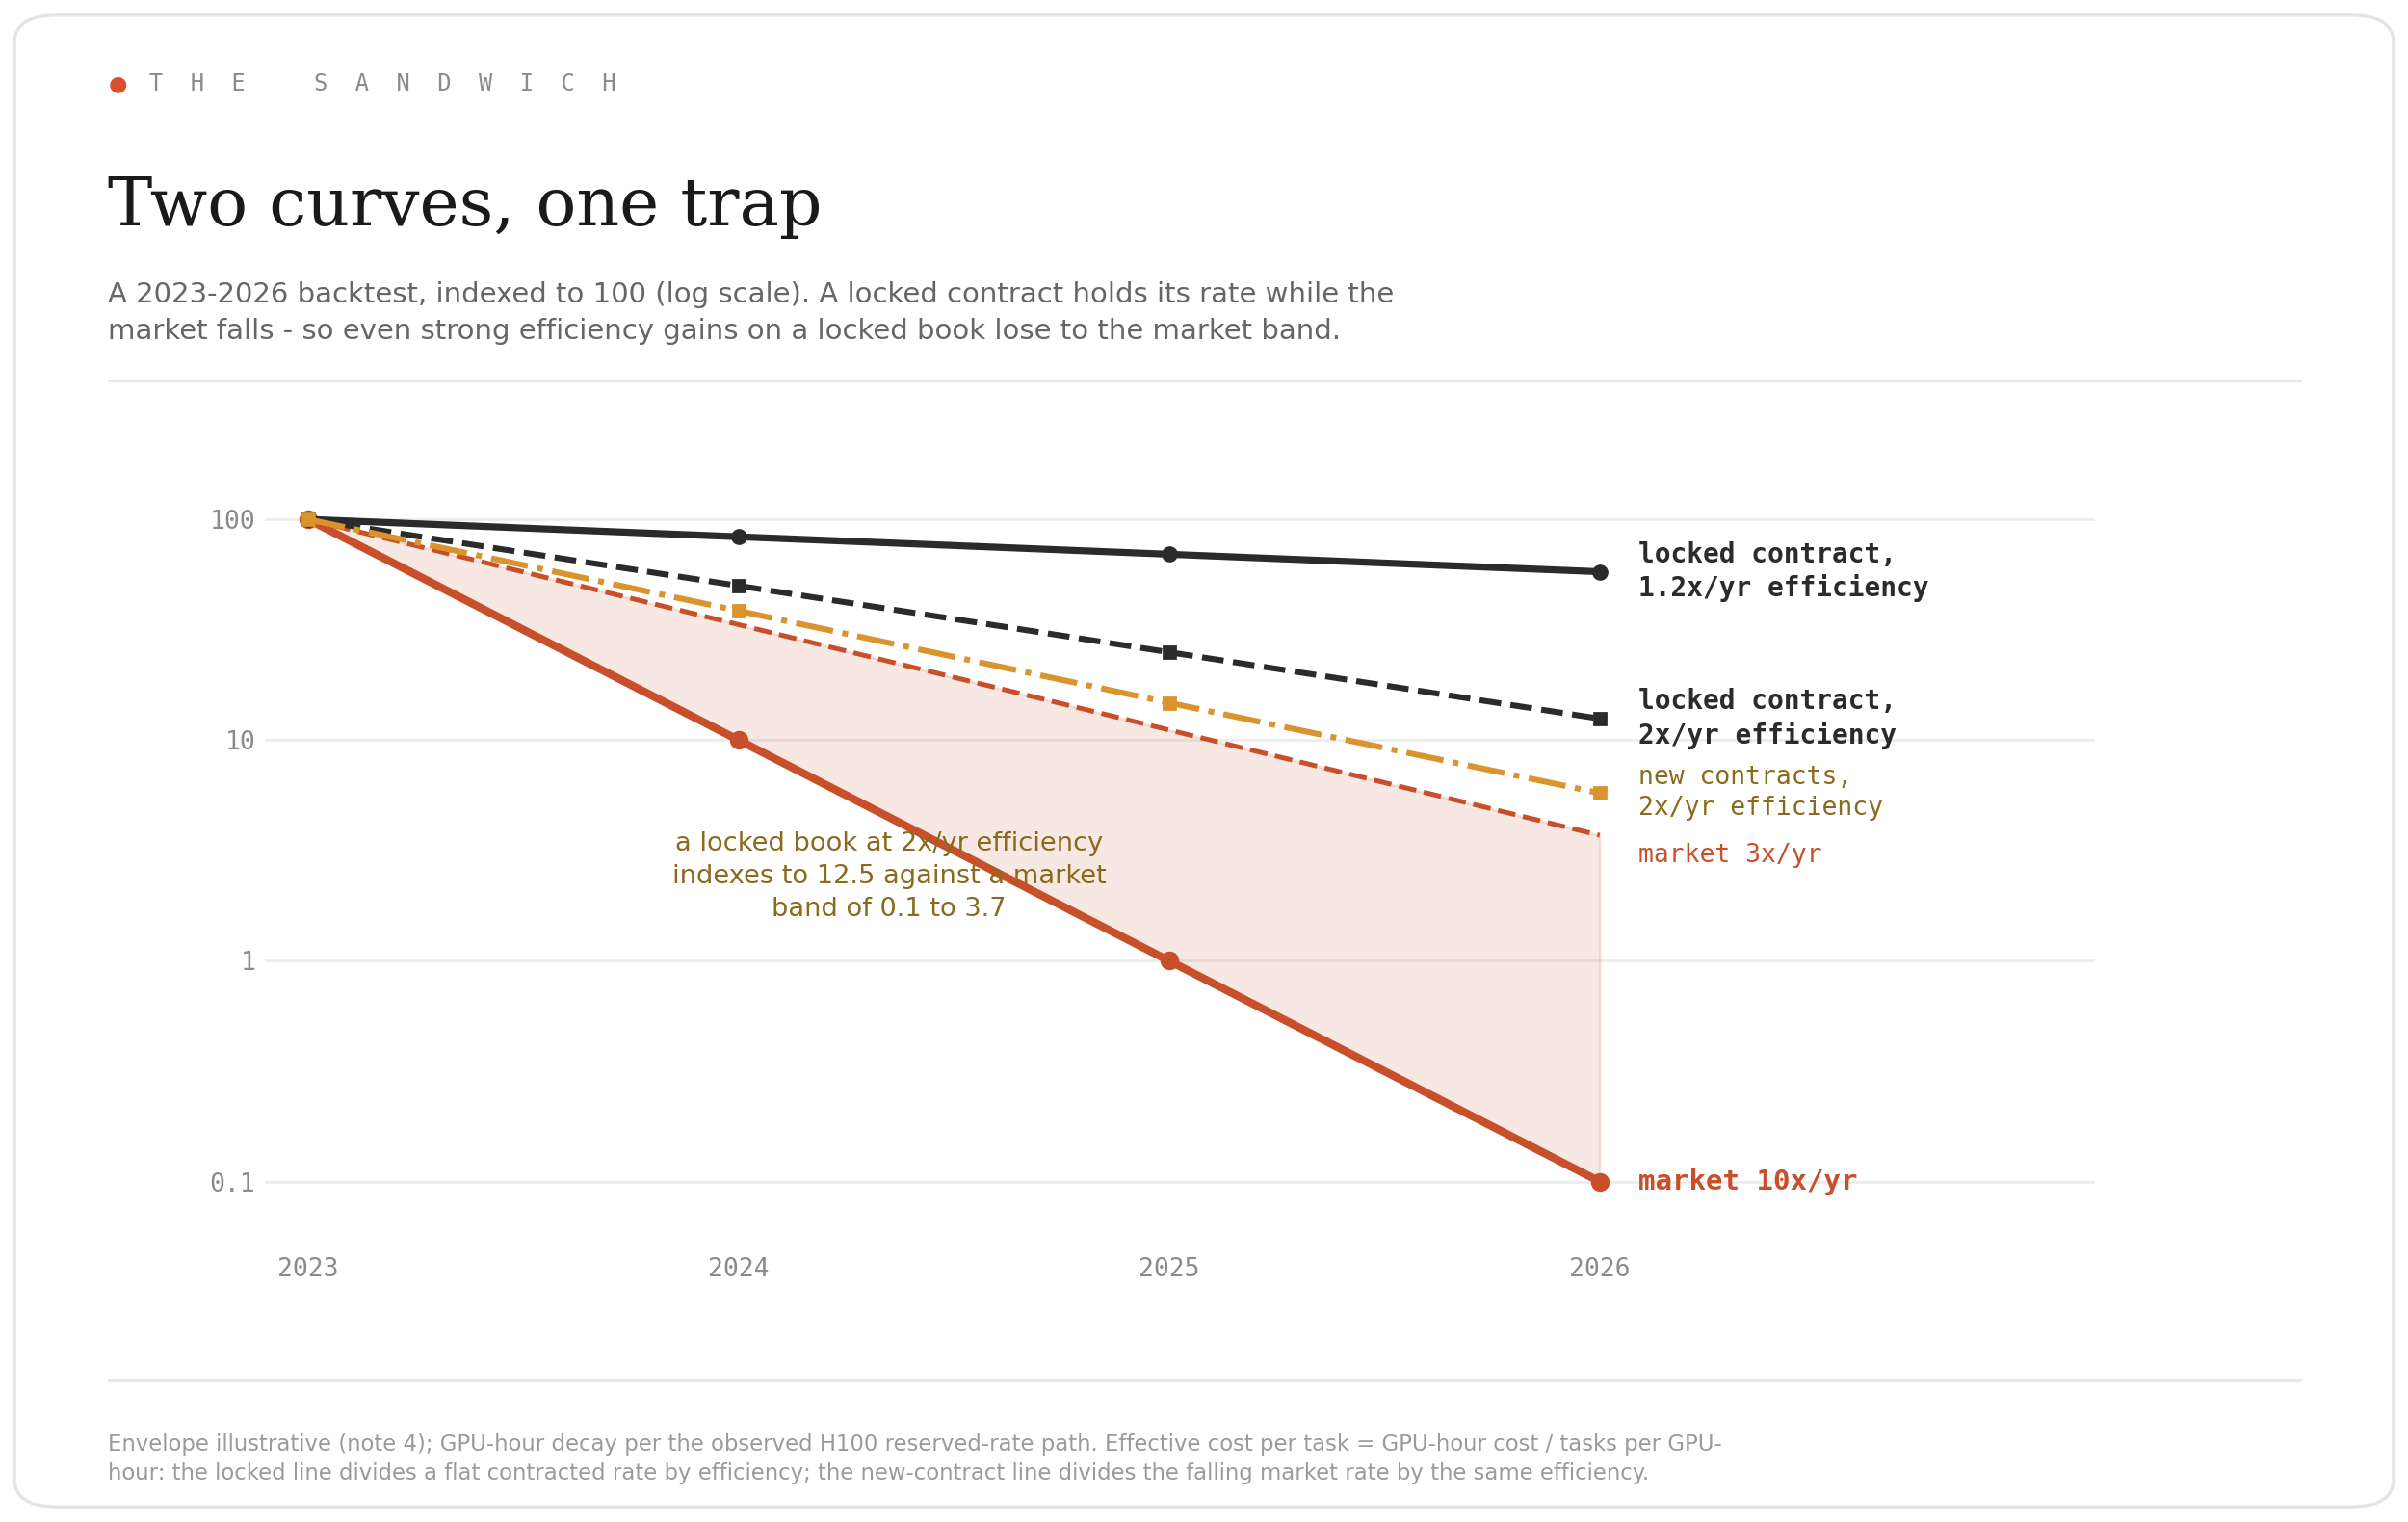
FIG. 02 Two curves, one trap - a 2023-2026 backtest indexed to 100 (log scale): the illustrative market envelope as a 3x-10x scenario band, a locked contract divided by 1.2x and 2x annual efficiency, and new contracts at 2x efficiency. A locked book at 2x still indexes to 12.5 against a market band of 0.1-3.7. Sources: a16z LLMflation, Epoch AI (note 4); observed H100 reserved-rate path.
This pattern is holding at the current frontier - the mid-2026 wave of open-weight releases now benchmarks alongside the closed flagships at a fraction of the price, and capability parity now arrives months behind the frontier, with every locked reserved rate marked accordingly. Consider total cost per standardized task against a frontier open-weight model - we find that Kimi K3 is burning twice the median output tokens on Artificial Analysis’s index and still lands at $0.94 per task against Claude Opus 4.8’s $1.80. In the cited benchmark set, the open frontier is at or below closed pricing per task, not just per token, and token prices are falling faster than hardware prices because model efficiency compounds on top of hardware deflation.
I strongly believe this “token sandwich” is real - your costs are contractually fixed, and the market value of the work those GPUs produce can fall beneath them even while GPU-hour prices themselves remain elevated: your realized price per standardized task falls an order of magnitude faster than anything on the cost line. This makes the “sandwich” really, as in any wholesale-retail business: the margin concentrates in the long tail of smaller customers paying list prices, while the largest deployments - the volume that actually fills the pareto distribution of commitments - consistently negotiate toward cost. The duration-matched revenue is the thin-margin revenue while the fat-margin revenue is spiky, short-duration, and has no real commitment at all because it will just keep flipping between inference providers over time based on lowest cost.
So the obvious question is - how to eat the sandwich?
In my view, the obvious way out is to make the fleet operate even faster and smarter than the rate at which both curves decline - which is precisely the stated trajectory across the current inference market, where individual providers claim roughly “50% to 60%” gross margins on the strength of a proprietary inference stack - Fireworks’ disclosed ~50% blended with a stated 60% target being the “documented case”. Obviously inference is a real and massive ARR-growing business, but it is ops-alpha, and it compresses as open-source serving engines close the gap from below in a game of cat and mouse. In my view, increasingly the alpha is decomposing into three primary levers - quantization, speculation, disaggregation - each capable of order-one gains under the right workloads, and each commoditizing every time a new model ships because quantized checkpoints ship within days of a release, and the newest open models now ship their own speculation heads in the weights.[5] In my experience, and based on discussion with a lot of friends and enterprises in the industry, the “levers” that earn the margin are the same levers being given away, which means that alpha has to be re-earned every quarter. I do believe that “optimization alpha” is compressing really quickly - kernels, quantization recipes, speculation techniques, scheduling - because open-source engines reproduce them incredibly fast - while “platform alpha” is more durable: reliability, supply access, networking, storage, security, observability and the ability to run heterogeneous infrastructure as one system. CoreWeave attributes its premium pricing to exactly this, and books over $400 million of ARR from storage, CPU, networking and software (note 2).
Ultimately, my belief is that the more durable strategy over time is to own beta - a new structural position in the stack that has more asymmetry and changes the economic game. This is likely to come from some new hardware innovation, or from a completely new model architecture, or broader research optimization that hasn’t been invented yet. If you consider that even frontier open models are now profiling their own serving stacks and writing replacement kernels that run in production - this is a loop where the serving alpha is generated by the model being served and will have diminishing returns.
The reality of scaled production workloads is stranger still - the same model, on the same software, on the same GPUs, can run cleanly in one datacenter and break in another - the variation in quality across “neoclouds” is honestly incredible - and tiny timing differences in the network are enough to trip bugs in the code running on the same chip. Providers sometimes resolve this by pinning hardened deployments to the specific clusters where they were validated, and if a machine’s behavior depends on where it sits, it’s not really an interchangeable asset - it’s a component of one specific system, priced as if it were interchangeable.
The world becomes heterogeneous
All this said, my first essay’s point applies to buyers as much as GPU owners - fundamentally, a locked-in commitment simply looses value on someone else’s timeline. The S curve of technology innovation always yields enormous margins in the beginning because the gradient of change is so steep, but over time these diffuse throughout the market and competition yields much tighter returns.
I believe this backtest should make one consider the forward implications, and the five-year forward view makes the sandwich worse, because the commitments being signed today were priced in a single-vendor world, but the industry generally accepts that they mature into a heterogeneous one. Heterogeneity fundamentally has four claims - vendor (whose silicon), architectural (what kind of machine), phase (prefill, decode, cache), and generation-and-site (which vintage, in which building) - and the missing understanding in the market is that they compound. The reality is that announced capacity is not deployed capacity, and deployed capacity is not capacity available to third parties. I was curious of public announcements and I tried to map these commitments with dates (so don’t take this as a true market-share forecast). If you check the chart below, what it means is that the contracts locking in Hopper and Blackwell through 2029 and 2030 will be marked against a supply landscape that looks nothing like the one they were signed into. We already have obvious signs of this movement today - external TPU sales and a Blackstone-funded TPU cloud, AMD’s MI450 generation at gigawatt scale for OpenAI, Anthropic’s 3.5 gigawatts of TPU capacity, Cerebras at wafer scale, AWS custom silicon - led by Trainium - reaching a $20B annualized run rate, Qualcomm’s rack systems with high-bandwidth memory and NVIDIA’s Rubin cadence resetting its own price-performance every year regardless.
Here is the timeline for each commitment, its window and its confidence (from the announcements I could) find illustrated below[6]:
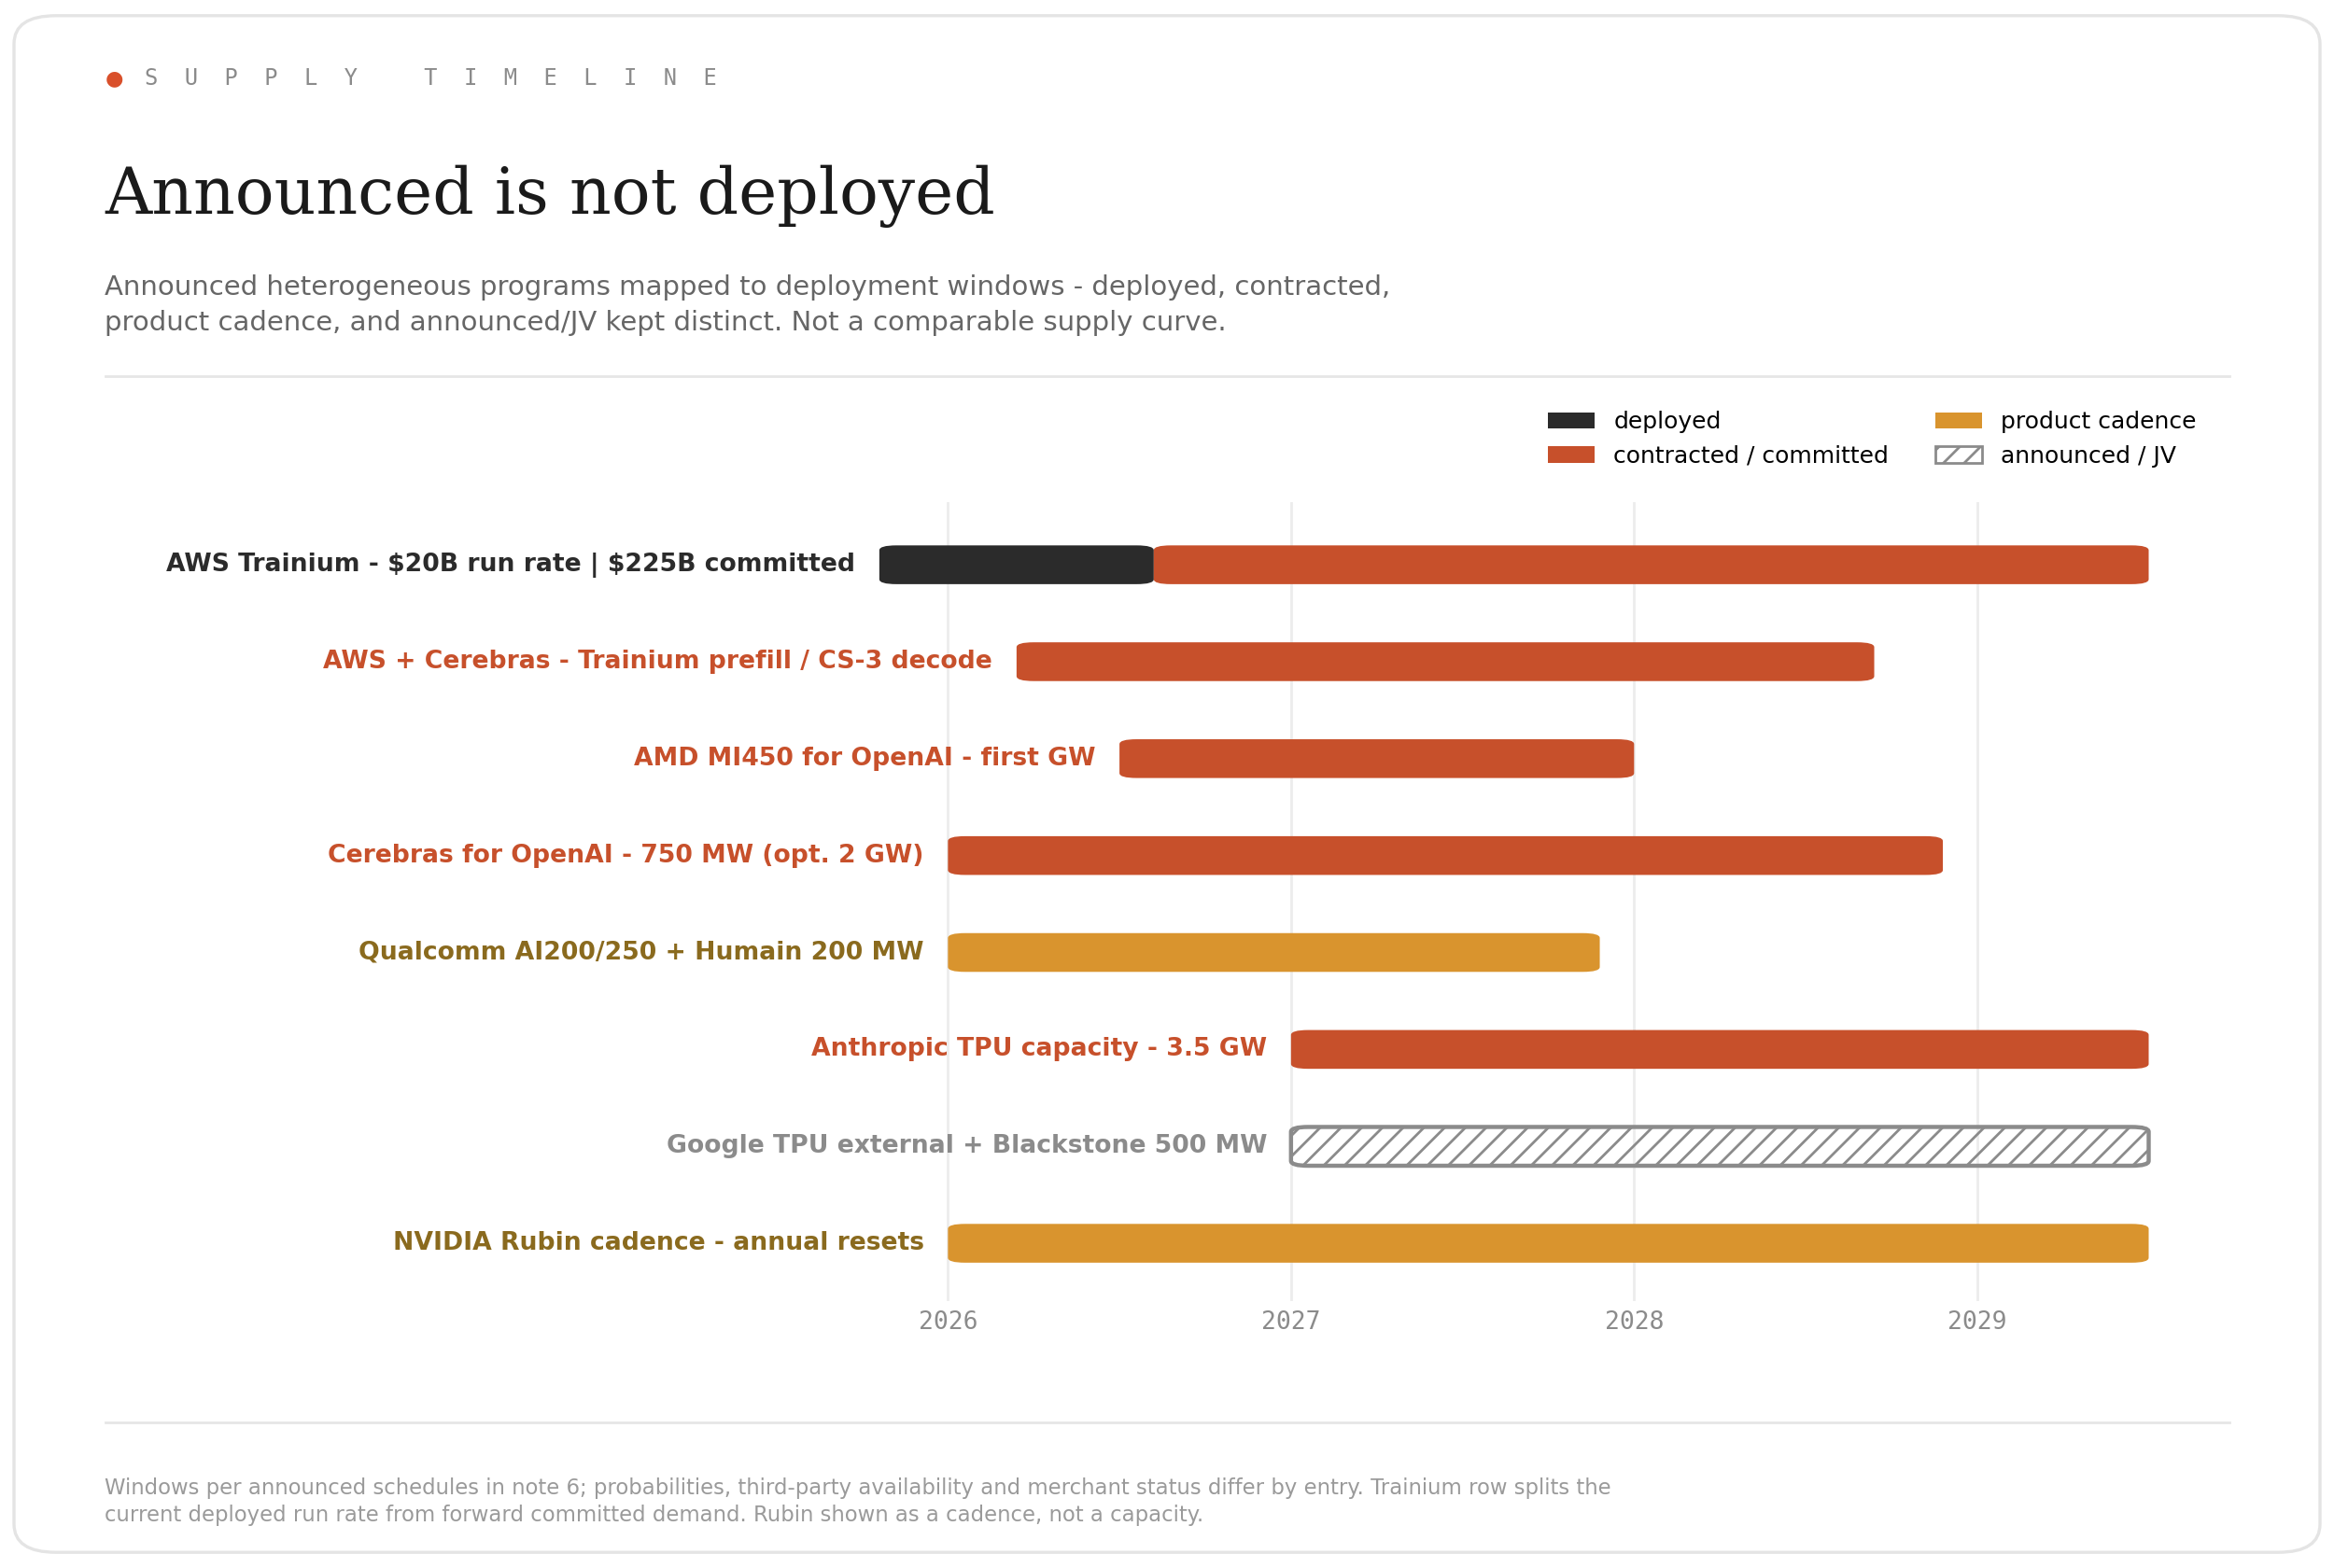
FIG. 03 Announced heterogeneous programs mapped to deployment windows - deployed, contracted/committed, product cadence, and announced/JV kept distinct, with the Trainium row splitting its deployed run rate from forward committed demand. Not a comparable supply curve; deployed is not merchant. Sources in note 6.
In December, NVIDIA itself paid roughly $20 billion to license Groq’s inference architecture and hire away its founding team - which is a significant tell - a $20 billion position on a rival inference architecture, which I read as a major hedge consistent with expecting a more heterogeneous inference market. AWS jumped in as well; as the largest cloud, they now pair their own Trainium silicon with Cerebras wafer-scale systems inside a single inference service - prefill on one vendor’s chip, decode on another’s - while its custom-silicon line runs at a $20 billion annualized pace against $225 billion of committed demand. When both the largest GPU incumbent, and the largest cloud, are engineering around a multi-architecture future - the direction should be increasingly clear to everyone. Interestingly, as GPUs grow more ASIC-shaped every generation (tensor memory, tile-scoped programming, phase-specialized SKUs like Rubin CPX) - many new entrants are trying to stay general enough to survive the next major architecture variant. The AWS-Cerebras pairing shows the heterogeneity is already happening but it’s software programmability that will turn this dual-architecture into a market-wide competitive unlock.
All this said, it’s interesting to reflect that any locked commitment today is always a bet against the future market price - and that price is about to change definition, from “next year’s NVIDIA chip” to “the cheapest capable silicon available from an expanding field.”[7] In this world, the floor resets downward every time the token leader changes - a lower envelope falls not because each curve is steeper, but because someone new keeps lowering it. The providers whose economics and deepest optimizations remain tied to fixed NVIDIA capacity are both the most exposed to that frontier and the least able to reach it, because a CUDA-shaped serving stack cannot readily route to the silicon that sets the new token floor without material re-engineering. If this world is true, then these folks become stranded twice over - they have supply contracted above the market, while also technically outside it from an engineering standpoint - a new entrant with no legacy commitments, and a portable stack, builds directly on the frontier and is so competitive on price that it can win a substantial share of the largest inference demand.
And heterogeneity is not only arriving between vendors - it is emerging inside the workload itself, as models add chain of thought, agents and continuous learning, each with a different computational shape - a cumulative “staircase” pattern that DeepSeek’s founder Liang Wenfeng describes in similar terms.[8] I made the same argument from two directions in What We Owe the Minds We Create and Scale or Surrender - the path forward is not a march toward one universal chip, but toward a widening portfolio of compute that must behave like one machine - and portability is what turns a collection of what we called at Google, “tech islands”, instead into one coherent and connected system.
We can already see the first version of this decomposition in inference itself - today, inference splits into two phases with opposite compute appetites → prefill, which is compute-bound, and decode, which is memory-bandwidth-bound - with the research record showing that serving them on different hardware is worth multiples, not percents - up to 7.4x more requests within latency targets in the DistServe work, 2.35x the throughput at the same cost in Microsoft’s Splitwise, and in production, Moonshot serves Kimi on a disaggregated, cache-centric fleet that handles 75% more requests, with gains up to 525% in long-context scenarios.[9] NVIDIA has now validated phase specialization in silicon - Rubin CPX is a prefill-specialized chip - GDDR7 instead of HBM, no NVLink - shipping at the end of this year paired with standard Rubin for decode in the same rack, and the company’s own framing at GTC was rack classes assigned to the phase each is cheapest to run - that confirms the phase split, not cross-vendor portability; the AWS-Cerebras pairing is the cross-architecture evidence. One possible strategic reading of the Groq license sharpens it further - SRAM-based LPUs for decode, GPUs for prefill - and on that reading, the $20 billion was NVIDIA buying the other half of a disaggregated future.
When the workload itself decomposes, the cost-optimal fleet is a portfolio of compute approached - mixed memory profiles, mixed compute densities, and mixed generations, because decode and cache tiers are exactly where older, cheaper silicon earns at the long tail of the market. The demand side supports that long tail too, as enterprises keep running the exact model version they tested and approved, often for years - it is common to find three-generation-old checkpoints still handling production batch jobs, because getting a thousand internal stakeholders is a huge pain in the ass. Old models executing on old chips is not a coincidence - proven production software that works is what keeps older hardware justified. The market is already pricing this: CoreWeave recently signed a contract for A100 capacity extending into 2029 at what it called an attractive price - a 2020 architecture (note 2). Jensen Huang even commented on this recently on X about the A100 lifetime of their hardware. However, it does not prove any particular A100 will earn for nine years - the purchase dates are undisclosed - but it gives the earning tail a concrete market example and re-emphasizes the point I made prior on software durability for chips.
Equally, a portfolio of compute ultimately needs a router - and the router’s scarcest resource is already clear in modern inference - KV-cache movement - state that must cross a network path whose bandwidth sits far below local HBM, often with extra staging and synchronization on the way - which is why the next hardware cycle is being designed around moving state rather than simply multiplying matrices together. Disaggregation turns portability into the architecture - so in my view, that world looks like even a single request, no longer having a single “best chip”.
So what happens?
The take-or-pay contracts that make GPU debt investment grade are clearly a fixed cost of goods, mapped against rapidly depreciating token prices. If token deflation outruns a platform’s optimization alpha, the margin squeeze arrives against the credit structure - CoreWeave’s DDTL 3.0 amendment showed the channel exists, as I highlighted in my prior essay. That is to say, customer delivery timing alone reached a GPU-backed covenant, requiring an amendment on one of its multi-billion-dollar facilities. CoreWeave’s financing now shows both sides of this transition. DDTL 3.0 showed that customer-delivery delays can reach an asset-backed covenant; DDTL 5.5 shows the reverse - lenders accepted a roughly five-year facility against customer contracts averaging about three years, leaving the debt dependent on renewal or re-leasing after the first contracts expire (note 2). That is early evidence of capital markets underwriting part of the infrastructure’s earning life beyond its first customer agreement - though it is still confidence in NVIDIA infrastructure on CoreWeave’s platform, not yet in a cross-vendor market for interchangeable compute.
If you follow the integration logic in both directions - the industry’s current shape starts to make sense. From below - in a market where the owner’s margin is often the most durable, every inference business is under pressure to become a miniature AWS or GCP - own the silicon, capture the infrastructure spread, and then sell the software on top - and the convergence is already visible in both directions.[10] CoreWeave is already living this: its managed-inference booked ARR went from roughly $1 million to more than $100 million within months, targeting at least $250 million by year-end - and management explicitly frames it as a way to put GPUs coming off contract back to work (note 2). CoreWeave is not merely exposed to the token sandwich; it is showing how an infrastructure owner can escape it by owning more layers of the stack. From above, it’s a fair bit scarier, as the model layer that consolidates to two or three labs earning software margins on inference can, over time, trend toward monopsony power over everything beneath it - power, data centers, silicon - and the biggest lab-silicon deals in FIG 03 are early illustrations of that.
So a world where every token seller must also become a data center owner is a world with a thin and incomplete market for compute - the difference between a concentrated model layer and a competitive one is not just margin - it is credit, as two or three natural buyers of the world’s compute is the A380 outcome (a reference in my prior essay to the aviation industry) applied to the entire fleet - collateral with a single exit. Fewer natural buyers mean thinner remarketing depth and lower recovery confidence today, while a competitive model layer - open weights at the frontier, vertically integrated entrants who treat the model as a cost center - is what “many exit buyers” looks like for compute collateral.
I learn that aviation did this in basically reverse - 2.4% of the world’s fleet was leased in 1980, more than half is today, as the asset became financeable, ownership unbundled toward lessors - financeability contributed to the shift rather than causing it alone - and operating an airline stopped requiring a balance sheet full of jets.[11] This is consistent with the incumbent vendor’s incentive to cheer for open source - in late July a 25-company letter, “Open Weights and American AI Leadership,” signed by NVIDIA, Meta, Microsoft, IBM and much of the American stack[12] - and why the two de-cornering forces travel together - open weights keep the model layer contestable, portability keeps the compute layer reachable. Within hours of a frontier open-weight drop, a dozen providers race each other’s tokens-per-second in public - the demand-side reflection of “many exit buyers,” running live every few weeks. A contestable model layer distributes bargaining power and demand more broadly through the stack - and broader demand is what could deepen the collateral confidence lenders need. The letter makes the competition, sovereignty, and security case for an open model layer; the credit case is the one it leaves clearly unaddressed. Vertical integration is best read as a response to missing markets rather than proof that owning everything is superior - companies own every layer of the stack because there is no reliable market that lets them buy the pieces instead.
Lastly, and I’ll make this same claim as I made in my prior essay - portability lowers the token-cost frontier and increases the pressure on market prices. If you compress the financing spread by the aviation-calibrated 100 to 250 basis points - my approximate numbers from the first essay - the hourly compute rate falls. This means you can stretch amortization across the asset’s real earning lifecycle, instead of a five-year forced period, and the hourly rate falls again. If you can lift utilization and arbitrage workloads onto whatever adequate silicon is cheapest - I predict it will fall a third time.
Every term of “the sandwich” improves for the buyer even as the curve gets steeper because portability converts a fixed bet into a “routing one” - it matters a lot that commitments are written against capacity “classes” instead of chip SKUs, and that a spot market exists that is fungible enough that the new compute futures become a hedge. Fundamentally, lenders finance token streams against a forward-looking curve - similar to the way power projects borrow against megawatt-hours - versus chips financed by credit. Ultimately, a token curve needs some type of grade, and tokens are not yet fungible across providers - so this means that quality drifts with quantization choices, speculators tuned to each provider’s traffic, and latency classes that differ. The financeable unit is not “a million tokens” - it is reference-model-equivalent inference at a defined quality and service level. The logit-fidelity tolerance, latency class, context length, throughput and uptime, geography and compliance - the way a real contract is specified. This first considers the portable cost curve as a fixed reference checkpoint and then secondly, considers task-capability benchmarks across unrelated models. Any mature market likely needs both, and so we need a better path to "certifying" this in the future.
The closing argument
Here’s my overall conclusion balanced against different arguments I’ve heard consistently from friends, and folks I’ve spoken too across the AI industry, that I thought I would address.
Portability is not free
The first argument comes from folks who are deep in the trenches of optimizing production workloads on LLMs - they consistently tell me that “portability is not free”. Every model-silicon pairing costs real bring-up and enablement time - quantization, a speculator trained from the base model’s own hidden states, parallelism and disaggregation tuned for interconnect, and then weeks of production hardening as live traffic finds what Artificial Analysis raw benchmarks miss for real customer workloads. Day-zero support means a token comes out - but the reality is that “production-ready inference” arrives much later, and it arrives per target. Multiply that by an expanding field and “cheapest adequate silicon” starts to look like a lot of unpaid engineering. I agree with that, and I’d note that cost is very high because a duplicative “fixed component” plus a smaller recurring per-target one, paid today per provider, per model, per chip - is exactly why its such a huge friction wall. Paid at a portability layer - amortized across operators and deployments, with a much smaller incremental cost per new target - the same cost is fundamentally a burden. While a portability layer adds its own abstraction, validation and coordination costs - the economic case I believe we are headed for is the amortized savings and routing optionality exceed them, and at fleet scale I believe they clearly do. The objection is really an argument about who bears the fixed cost of heterogeneity, not about whether the frontier exists.
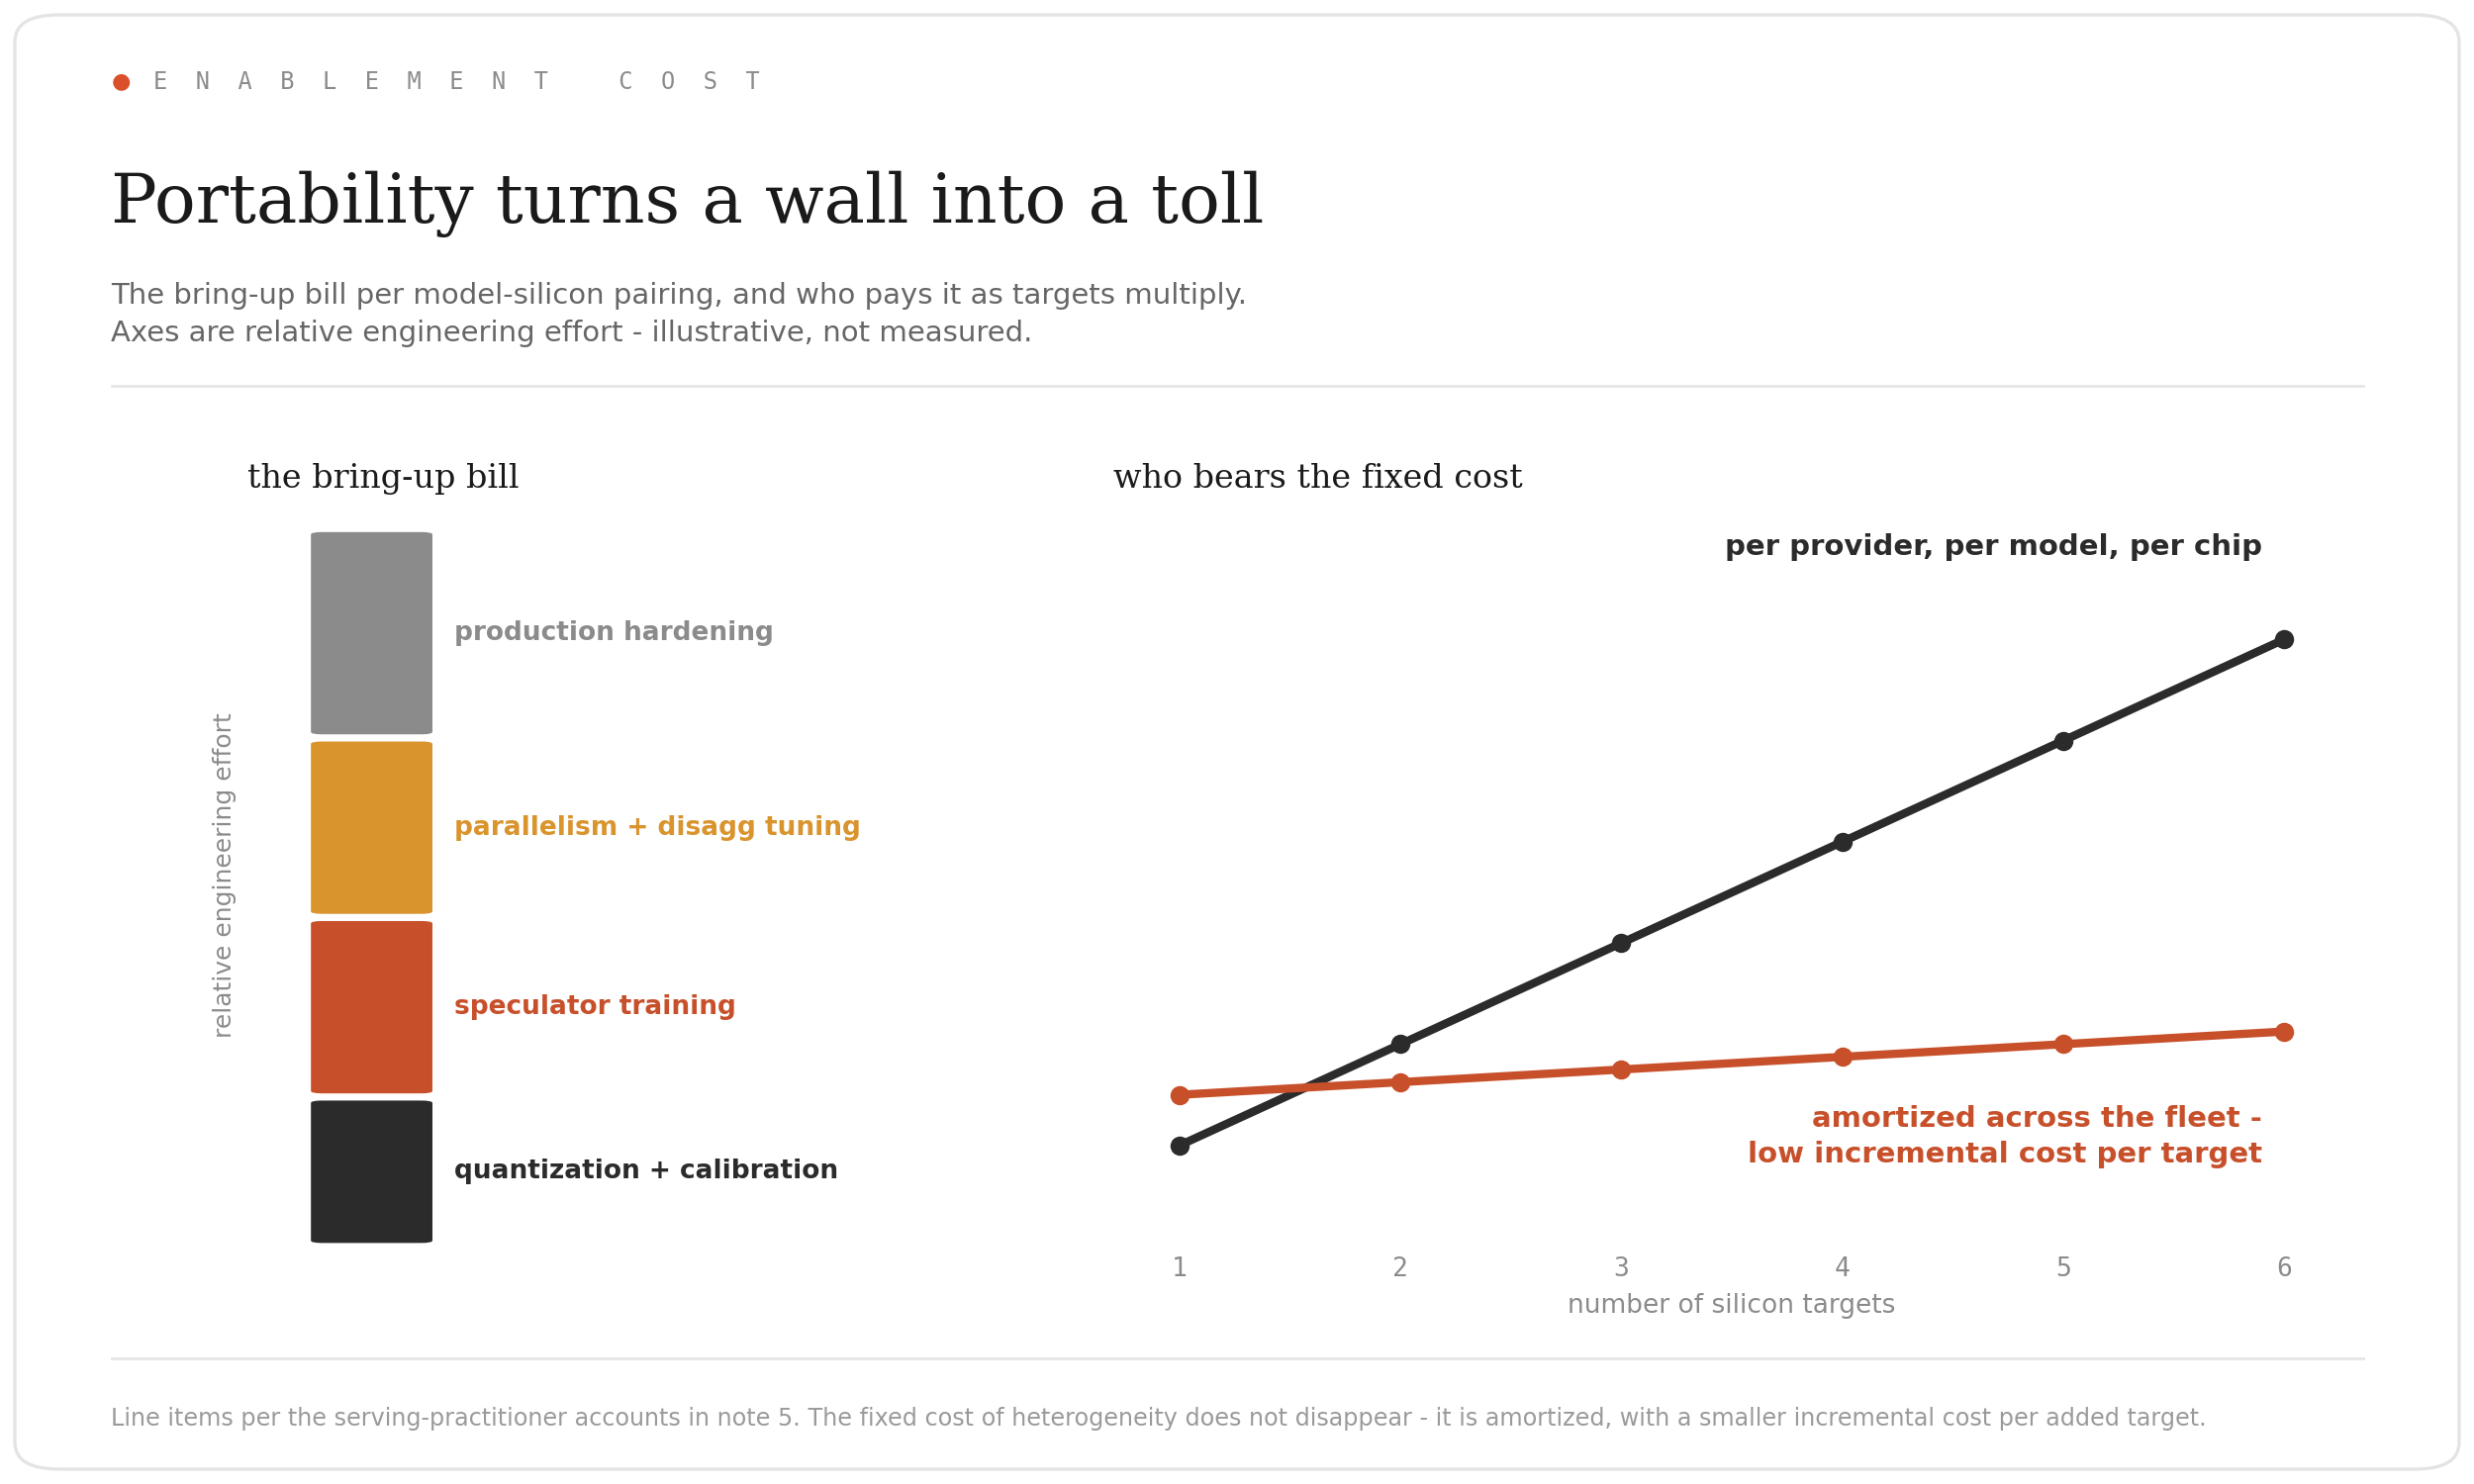
FIG. 04 The enablement stack per model-silicon pairing, and cumulative enablement cost against the number of silicon targets - captive paid per provider per pairing vs a portability layer amortized with low incremental cost per target. Axes are relative engineering effort; illustrative, not a forecast (note 5).
GPU rates are spiking higher
The second argument I have both discussed extensively, and read about, is that the inversion of GPU prices is evidence that token prices are just going to get higher. Gavin Baker argued in an X post in late July 2026 that because spot GPU rental rates are running at least twice contracted rates, it means the hyperscalers are under-earning. His conclusion was that as contracts roll off and reprice higher, operating cash flow accelerates enough to fund the buildout, credit spreads compress, and the financing worry dissolves.[13] Indeed, if the world’s token appetite continues to explode and older GPU fleets rebook near original pricing - both claims my first essay makes - then locked commitments aren’t stranded, they are actually the only way to get capacity at all.
CoreWeave’s second-quarter results are the strongest evidence yet for the demand-heavy branch of this argument: near-term capacity effectively spoken for, prior-generation pricing at or above year-ago levels, a roughly 25% price increase across SKUs in July, and contribution margins on newly signed contracts expected to run five to ten points above prior quarters (note 2). That does not mean fixed-capability inference prices have stopped falling - it means GPU-hour scarcity and the market price of standardized inference can move in opposite directions, and may keep doing so while power and single-vendor supply remain the binding constraints.
The challenge to this argument is history - on the assumptions I’ve used here - constant-capability prices fell at roughly tenfold a year straight through the worst compute scarcity on record, and that argument survives the 3x and 5x cases too, because the deflation is driven by model efficiency and open-weight competition, not by hardware gluts. However, strong demand solves the “wrong half” of the problem - while it keeps a reversed compute fleet fully busy, it cannot stop the price of what that compute produces from falling. I believe these two “branches” frame the uncertainty pretty well - in the demand-heavy branch, commitments resell while margin pressure builds; in the demand-soft branch, the heterogeneous frontier essentially crushes pricing. These are pressure mechanisms, not guaranteed outcomes - but a provider locked to one hardware stack is poorly hedged in either branch - I don’t see how that position wins both - and hedges are precisely what a portable spot market and a futures curve exist to provide. As I understand his case, it holds while that scarcity persists - and spot rates above contract are exactly what it looks like today. However, my position is that when the heterogeneous capacity starts landing, that logic flips - the same contract roll-off he is counting on becomes the mechanism that reprices compute downward. And to the objection that today’s heterogeneous fleets are non-existent - I would state that prices are set at the margin, not by the average - but only once enough workloads can actually access, qualify and substitute onto that capacity at meaningful volume. From there, qualified heterogeneous capacity at meaningful scale can begin resetting marginal prices - portability is one of the prerequisites that qualifies it, alongside fidelity, volume, service levels and merchant availability - and private capacity can increasingly become merchant capacity at that price. Google now sells TPUs outward, Trainium is rapidly scaling, Cerebras and Trainium are being paired, NVIDIA licensed Groq’s architecture inward, and FIG 03 maps exactly this arrival schedule.
AI ops is the real moat
The third argument is the least discussed, but one of the strongest in my view as the scaled evidence is already in plain sight. That argument is that serving excellence is the actual moat - open-source engines are free, the last mile matters most - and a heterogeneous world makes that last mile harder and therefore more valuable, the way Linux being free made EC2 a money machine. If you look at what EC2 actually is - Amazon runs Intel, AMD and its own Graviton behind one control, procurement and operational layer - distinct instance classes, not perfect interchangeability - and then they basically arbitrages them incredibly well. EC2 is the closest realized version of the portability thesis at the CPU layer, and its margin comes from owning the fungible compute substrate and the operational excellence on top - not from captivity to one hardware vendor. I’m arguing this is exactly the position that inference platforms should want - become the AWS of accelerators. What portability displaces is not the serving margin - it is the captivity rent - and a platform whose stack cannot route to the silicon that enables the fastest tokens is defending the wrong thing. Portability removes captivity rent; it does not remove the margin earned by running a superior platform.
Portability needs to be vendor neutral
The fourth argument is that any portability layer that is successful ultimately becomes the new lock-in - our new world has just moved the concentration, not removed it, and I agree with this point. A portability layer only catalyzes if it has open interfaces, reproducible tests a third party can run, flexible licensing rights that can survive any single vendor, and enables a global ecosystem to implement and replace their existing layer. That is the standard I have always believed in, and it’s critical that this is the standard we drive in the future.
Where this leaves the market
All in all, lets combine these conclucsions and create a simple example that forecasts the world they create.
Let’s imagine that we take the “captive financing” from the Every GPU loan is really a software loan essay - those mechanics look like a sub-five-year repayment schedule, secured debt near 8.8% (the 9.75% unsecured debt sits above it), and compute that is roughly half idle - and we replace each term with a more liquid-market case using the learnings from aviation: lower financing costs, a longer earning life supported by residual demand and remarketing, and utilization lifted by workload routing. Under those terms, the liquid-market required recovery falls from $1.60 to roughly $0.77 per GPU-hour - a scenario, not an outcome portability alone demonstrates.[14] Cross-silicon competition then presses the price further down because a clearing level would need a supply-and-demand model. To make that clear and translate that into token economics: the production serving rate documented in note 5 - roughly 300 to 400 tokens per second on a trillion-parameter-class model - is a replica rate (I couldn’t find the full config details) so I won’t convert it into absolute dollars per million tokens. Holding workload and throughput constant though, the ratio is independent of replica size: $1.60 against $0.77 of required recovery means the liquid-market case roughly halves the capital-recovery component of every million tokens served.
To be clear - I am not estimating the percentage reduction in total break-even token cost, since power, networking and operations shares vary widely by deployment. Portability is not the sole source of the earning tail - CoreWeave is generating one inside NVIDIA’s ecosystem today. Its role is to broaden that tail - expanding the qualified hardware, workloads, operators and exit buyers available to the asset, and making its value less dependent on one vendor’s software stack. And the chart’s real point is to emphasize that the spread compression is worth six cents, and a longer amortization window is worth forty-nine. The interest rate matters less than the amortization window that portability could help lenders support. If we strip the extension out - keep the 4.5-year window, with the better financing at 75% utilization - and the requirement only reaches about $1.13 - so the window is the dominant term in this capital-recovery model. A longer window also has to be real: the economic condition where the older machine’s lower acquisition cost and routing value outweighs a newer chip’s power efficiency and performance - the same old checkpoint can be cheaper to run on new silicon, so residual demand has to be factored in. Portability helps lenders underwrite a longer life; it does not by itself create one. Essentially, the simple flow is that financing terms set the required hourly rate, the hourly rate sets the operator’s break-even token cost, and portability can improve financing, utilization and hardware choice at once - while adding the validation and coordination costs above.
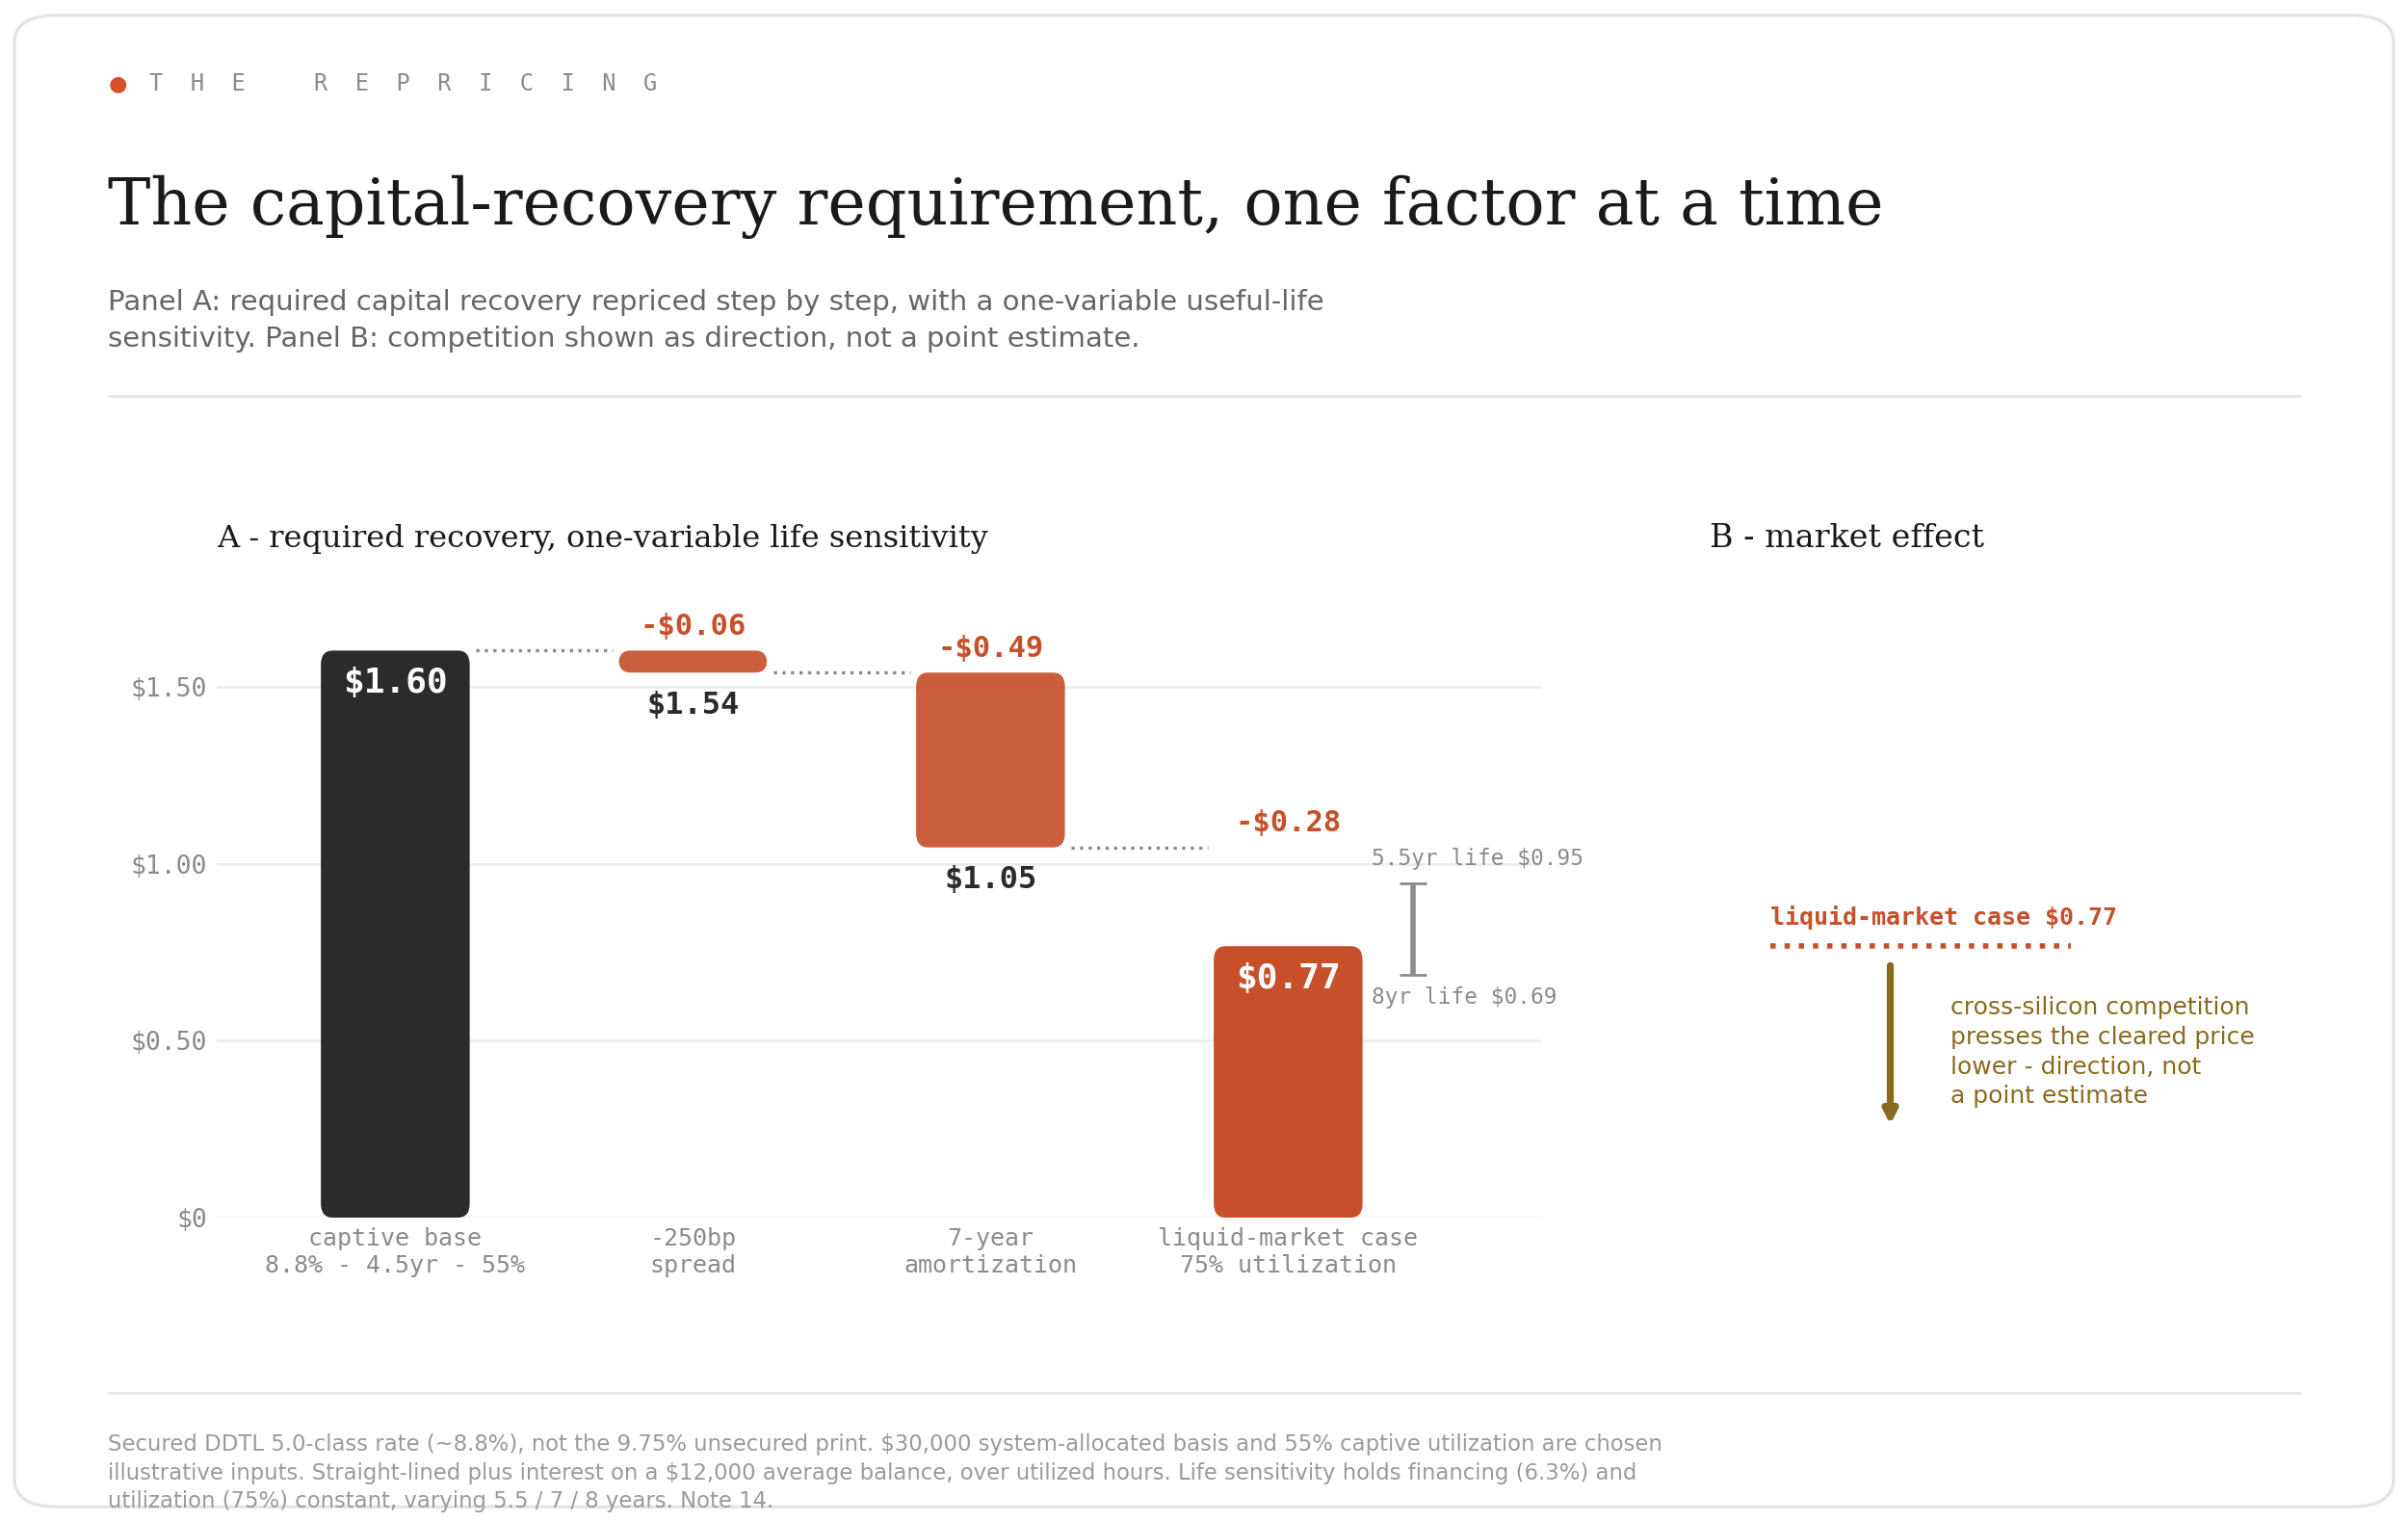
FIG. 05 Panel A: required capital recovery per GPU-hour repriced one factor at a time to an illustrative liquid-market case, with a one-variable useful-life sensitivity (5.5 / 7 / 8 years at fixed financing and utilization). Panel B: cross-silicon competition as direction, not a point estimate. Illustrative model on a secured captive comparator; assumptions in note 14.
Token demand is compounding faster than any industrial input I have ever seen, token prices are collapsing underneath it (and are likely to continue falling), and financing currently protects itself from that deflation through short amortization, customer contracts and credit wrappers, rather than underwriting against a transparent forward token-cost curve. My first essay argued that making silicon programmable and making it financeable are the same problem, and this essay argues that once a portable layer gives the market a visible cost curve, the long-contracted GPU market gets repriced significantly. CoreWeave shows that software continuity and operational scale can already create reuse, recontracting and liquidity inside one hardware ecosystem - portability’s larger promise is to extend that liquidity across vendors and expand the pool of workloads, operators and buyers available to each machine. Once enough heterogeneous capacity becomes production-ready, merchant and reachable through portable software, it becomes qualified substitute supply and begins resetting the marginal cost of inference. When portability then makes that capacity easy to measure, easy to reach, and possible to hedge, falling token prices stop being a threat and become an input variable into a loan. At that point, what gets financed could shift from the chip itself to the work it produces - a verified unit of inference, the token.
Footnotes
1. The Bank for International Settlements gap measurement per I. Aldasoro, S. Doerr and D. Rees, “Financing the AI boom,” BIS Bulletin No. 120, January 2026 - https://www.bis.org/publ/bisbull120.pdf . Tokens served per Sundar Pichai’s Google I/O keynotes: 9.7 trillion per month (May 2024), roughly 480 trillion (May 2025), over 3.2 quadrillion (May 2026) - https://blog.google/innovation-and-ai/sundar-pichai-io-2026/ . Alphabet capital expenditures: $52.5 billion (2024) and $91.4 billion (2025) per the FY2025 10-K - https://www.sec.gov/Archives/edgar/data/1652044/000165204426000018/goog-20251231.htm ; 2026 guidance of $175-185 billion in February (per CNBC - https://www.cnbc.com/2026/02/04/alphabet-resets-the-bar-for-ai-infrastructure-spending.html ), raised to $180-190 billion at Q1, then to 195-205billiononJuly22,2026;thechartusesthe~200 billion midpoint. Capex per million tokens = calendar-year capex ÷ (May monthly tokens × 12): $52.5B ÷ 116T ≈ $451; $91.4B ÷ 5,760T ≈ 16;~200B ÷ 38,400T ≈ $5. This is an intensity ratio, not a unit cost: capex leads usage, includes training and non-serving infrastructure, and Google’s token count spans all surfaces. Constant-capability market price per note 4, anchored at GPT-4-class output of roughly $60 per million (March 2023) declining ~10x per year. Methodology for the capex-intensity series: calendar-year Alphabet capex divided by twelve times the May keynote monthly token run-rate; Google’s token definitions and scope may not be consistent across years, so treat it as directional intensity, not unit cost - halving or doubling the run-rate assumption moves the 2026 figure between roughly $2.50 and $10 per million tokens.
2. CoreWeave Q1 2026 earnings release (SEC-filed), including total debt of $24.86 billion and interest expense of $536 million on revenue of $2,078 million - https://www.sec.gov/Archives/edgar/data/0001769628/000176962826000220/coreweave1q26earningspress.htm . The DDTL 3.0 covenant amendment (effective December 31, 2025) per CoreWeave Form 8-K filed January 2, 2026, following customer delivery-timing changes - the amendment reduced the minimum liquidity requirement, postponed initial covenant-testing dates and expanded equity-cure rights - https://www.sec.gov/Archives/edgar/data/1769628/000176962826000003/crwv-20251231.htm . CoreWeave Q2 2026 results: revenue of $2.575 billion with net interest expense of $640 million (roughly 25 cents per revenue dollar) and depreciation and amortization of $1.393 billion; adjusted EBITDA margin of 59% against a 5% adjusted operating margin; a roughly $104 billion revenue backlog with more than $25 billion of additional commitments after quarter-end; a roughly 25% price increase across SKUs in July; expected contribution margins on newly signed contracts five to ten percentage points above prior quarters; prior-generation ASPs at or above year-earlier levels with Ampere and Hopper fleets described as largely sold out; an A100 capacity contract extending into 2029 at what management called an attractive price; managed-inference booked ARR growing from roughly $1 million to more than $100 million within months, targeting at least $250 million by year-end and framed as redeploying GPUs coming off contract; and over $400 million of ARR from storage, CPU, networking and software - https://investors.coreweave.com/news/news-details/2026/CoreWeave-Reports-Strong-Second-Quarter-2026-Results/default.aspx . DDTL 5.5: a $2.6 billion facility of roughly five-year money against customer contracts averaging about three years, with renewal or re-leasing of the capacity contemplated - reflecting lender willingness to underwrite renewal risk - https://investors.coreweave.com/news/news-details/2026/CoreWeave-Closes-2-6-Billion-Loan-Facility-Expanding-Financing-Flexibility-for-AI-Infrastructure/default.aspx
3. Representative providers in this layer include Fireworks AI, Baseten and Together AI. Procurement and margin figures per Sacra research on Fireworks AI (reserved capacity contracted on longer commitments; ~50% blended gross margins with a stated 60% target via utilization improvements; revenue “likely concentrated among a smaller number of large production deployments” against a customer base of 10,000+) - https://sacra.com/research/fireworks-ai/ ; Baseten $300 million Series E at $5 billion, February 2026, per the same. The margin gradient described in the text - expansive on smaller list-priced customers, compressing sharply on individually negotiated large deployments - is stated as market structure, not as a disclosed figure.
4. Guido Appenzeller, “Welcome to LLMflation,” Andreessen Horowitz, November 2024 (10x per year for equivalent performance; GPT-3-class from $60 to $0.06 per million tokens, 2021-2024) - https://a16z.com/llmflation-llm-inference-cost/ ; Cottier, Snodin, Owen and Adamczewski, “LLM inference prices have fallen rapidly but unequally across tasks,” Epoch AI (9x-900x per year by task) - https://epoch.ai/data-insights/llm-inference-price-trends . Current-frontier pricing: MiniMax M3 at 0.30/1.20 per million tokens in/out, June 2026 - https://developer.puter.com/tutorials/minimax-api-pricing/ ; GLM 5.2 at 1.40/4.40 and aggregate scores alongside or above closed flagships per BenchLM’s July 2026 index (M3 and Claude Opus 4.5 both scoring 71; GLM 5.2 at 81 vs Gemini 3 Pro at 79) - https://benchlm.ai/llm-pricing ; Moonshot Kimi K3 at 3/15, released July 16, 2026, per Artificial Analysis - https://artificialanalysis.ai/models/kimi-k3 . Per-task cost and verbosity per Artificial Analysis’s Intelligence Index: Kimi K3 at $0.94 per task on ~130M output tokens (double the 63M median; 21% fewer than K2.6), GPT-5.6 Sol at $1.04, Claude Opus 4.8 at 1.80,GLM-5.2at~0.32-0.47 - https://x.com/ArtificialAnlys/status/2077832874183860404 . Aggregate benchmark indices are directional, not definitive. The ~23% annual GPU-hour decay is the author’s synthesis of US-region one-year reserved H100 (SXM) rates across 2023-2026 from the SemiAnalysis rental index and Silicon Data tracking (the first essay’s FIG 01); spot rates and other regions differ. The constant-capability envelope in FIG 01 and FIG 02 is a single illustrative construction - a fixed reference task at a defined quality threshold, anchored at GPT-4-class output in March 2023 - not a measured index; the a16z GPT-3-class arc and the current-model per-task examples are observations within the same envelope at different dates.
5. Latent Space: The AI Engineer Podcast, “The Inference Engineering Masterclass,” with Baseten’s Philip Kiely and Ali Taha (hosts swyx and Vibhu Sapra), August 2026 - https://www.latent.space/p/inference-eng . Kiely describes a production loop in which GLM 5.2 profiles Baseten’s serving stack and writes replacement SGLang GPU kernels that then serve GLM 5.2 itself, validated by a second trace with a human pulling the image; the same conversation documents the roughly 10x gap between off-the-shelf and production serving (30-50 versus 300-400 tokens per second on a trillion-parameter model), quantization fidelity verified at the logit level via KL divergence, identical weights behaving differently across clusters, and KV-cache movement and interconnect as the next bottleneck.
6. Heterogeneous supply arriving 2026-2030: Google Q1 2026 earnings call - TPU hardware sales with the bulk of revenue expected in 2027, per the company’s Q1 2026 earnings call; Blackstone-Google TPU cloud, first 500 MW targeted for 2027; Anthropic agreement with Google and Broadcom for 3.5 GW of capacity starting 2027, per Futuriom - https://www.futuriom.com/articles/news/google-and-blackstone-to-create-tpu-cloud-service/2026/05 ; AMD-OpenAI agreement, October 2025: 6 GW of MI-series capacity across generations, first gigawatt of MI450 in the second half of 2026; Cerebras-OpenAI Master Relationship Agreement, December 2025: 750 MW of wafer-scale inference capacity in tranches 2026-2028, option for a further 1.25 GW, and $24.6 billion of remaining performance obligations per the S-1, via SemiAnalysis - https://newsletter.semianalysis.com/p/cerebras-faster-tokens-please ; Qualcomm AI200 and AI250 rack-scale inference systems, commercially available 2026 and 2027 on an annual product cadence, with Humain deploying 200 MW from 2026, per Data Center Dynamics - https://www.datacenterdynamics.com/en/news/qualcomm-launches-ai200-and-ai250-chip-offering-targeting-inferencing-workloads-at-rack-scale/ ; NVIDIA-Groq: roughly $20 billion non-exclusive license of Groq’s LPU inference technology plus the hiring of founder Jonathan Ross and senior team, December 2025, with Groq pivoting to an inference cloud on a $650 million raise, per TechCrunch - https://techcrunch.com/2026/06/22/ai-chipmaker-groq-confirms-650m-raise-re-staffs-after-nvidias-20b-not-acqui-hire-deal/ and Bloomberg - https://www.bloomberg.com/news/articles/2026-06-22/groq-raises-650-million-to-help-startup-pivot-after-nvidia-deal ; Meta TPU agreement reported 2026, per The Next Web - https://thenextweb.com/news/google-blackstone-tpu-cloud-joint-venture-5bn ; NVIDIA Rubin on the publicly committed one-year cadence. Deployment windows in FIG 03 reflect these announced schedules by confidence category. Not forecasts. AWS Trainium: custom-silicon annualized run rate above $20 billion with $225 billion in multi-year commitments per Amazon’s Q1 2026 earnings call (April 29, 2026); OpenAI committed roughly 2 GW of Trainium (ramping 2027) and Anthropic up to 5 GW across Trainium generations, per Data Center Dynamics - https://www.datacenterdynamics.com/en/news/aws-partners-with-big-chip-co-cerebras-for-ai-inference-disaggregation/ . AWS-Cerebras disaggregated pairing (Trainium prefill, CS-3 decode, EFA interconnect, on Bedrock), announced March 13, 2026 - https://www.cerebras.ai/press-release/awscollaboration
7. “Adequate” is measurable, not rhetorical: fidelity to the reference model attested at the logit level - KL divergence between served and reference output distributions within tolerance - at the workload’s latency class and context length. The attestation infrastructure exists in embryo: model developers publish vendor-verification suites (Moonshot’s K2 Vendor Verifier is the template), and serving providers publish logit-fidelity audits of their own quantizations (note 5). It is the same infrastructure a token forward curve needs for grading.
8. Liang Wenfeng investor-call transcript, recorded May 20 and compiled July 16, 2026, pp. 9-11, 13 and 31-35. Liang describes AI development as a cumulative staircase from language models to chain of thought, agents and continuous learning. He treats self-iteration as a consequence of continuous learning and embodiment as downstream of self-iteration, rather than as separate intermediate rungs. The circulated document was generated through automated speech recognition, cleaned with AI, and uses speaker labels inferred from context.
9. Disaggregated serving: Zhong et al, “DistServe: Disaggregating Prefill and Decoding for Goodput-optimized Large Language Model Serving,” OSDI 2024, arXiv:2401.09670 (up to 7.4x more requests within latency targets) - https://arxiv.org/abs/2401.09670 ; Patel et al, “Splitwise: Efficient Generative LLM Inference Using Phase Splitting,” ISCA 2024, arXiv:2311.18677 (2.35x throughput at the same cost and power) - https://arxiv.org/abs/2311.18677 ; Qin et al, “Mooncake: A KVCache-centric Disaggregated Architecture for LLM Serving,” FAST 2025 best paper, arXiv:2407.00079 (Moonshot’s production Kimi platform; 75% more requests handled, up to 525% throughput in long-context scenarios) - https://arxiv.org/abs/2407.00079 ; NVIDIA Dynamo disaggregated inference framework (GTC, March 2025); Rubin CPX prefill-specialized GPU (September 2025; 30 PFLOPS NVFP4, 128 GB GDDR7, no NVLink; Vera Rubin NVL144 CPX with 144 CPX + 144 Rubin GPUs shipping end-2026; NVIDIA projects $5 billion of token revenue per $100 million invested) per SemiAnalysis - https://newsletter.semianalysis.com/p/another-giant-leap-the-rubin-cpx-specialized-accelerator-rack and Futurum - https://futurumgroup.com/insights/nvidias-new-rubin-cpx-targets-future-of-large-scale-inference/ ; NVIDIA’s post-Groq inference architecture (GPUs for prefill, SRAM LPUs for decode) per Spheron - https://www.spheron.network/blog/nvidia-rubin-cpx-long-context-inference/ Practitioner consensus increasingly locates the next order-of-magnitude unlock in interconnect and state movement rather than raw FLOPs - see the serving-stack accounts in note 5. The cross-vendor version is now shipping: AWS pairs Trainium prefill with Cerebras CS-3 decode over EFA as a Bedrock service (note 6).
10. Convergence from both directions: Together AI’s co-built GPU cluster and data center program with Hypertec/5C (36,000 NVIDIA GB200 NVL72 GPUs announced November 2024; secured capacity for 100,000+ GPUs; up-to-2 GW European AI-factory alliance announced June 2025) - https://www.prnewswire.com/news-releases/together-ai-and-hypertec-cloud-join-forces-to-co-build-turbocharged-nvidia-gb200-cluster-of-36k-blackwell-gpus-302308267.html ; https://hypertec.com/hypertec-expands-into-europe-with-5c-and-together-ai-a-strategic-ai-infrastructure-alliance-driving-up-to-5-billion-in-private-investments/ ; CoreWeave’s acquisition of Weights & Biases (announced March 2025), an operator buying up the stack into developer tooling and inference.
11. Aircraft leasing’s unbundling arc: 2.4% of the global fleet leased in 1980; the leased share of the world’s passenger jet fleet crossed 50% for the first time in 2021 per Cirium; 51.3% (12,000+ aircraft) by late 2024 per Air Lease founder Steven Udvar-Hazy - https://aviationweek.com/air-transport/airlines-lessors/proportion-leased-aircraft-stabilize-around-50-lessor-says ; CAPA, “Aircraft leasing in equilibrium at just over half the world fleet,” February 2024 - https://centreforaviation.com/analysis/reports/aircraft-leasing-in-equilibrium-at-just-over-half-the-world-fleet-675212
12. “Open Weights and American AI Leadership,” open letter, July 24, 2026; 25 signatories including NVIDIA, Meta, Microsoft, Andreessen Horowitz, IBM, Mistral, Hugging Face, Mozilla, the Linux Foundation, Palantir, Perplexity and Y Combinator - https://www.microsoft.com/en-us/corporate-responsibility/topics/open-weight/ ; shared by Jensen Huang as his first post on X (“The world needs both frontier closed models and frontier open models”), coverage per Decrypt - https://decrypt.co/374282/nvidia-meta-microsoft-washington-dont-kill-open-source-ai
13. Gavin Baker (Atreides Management), X thread, July 28, 2026 - https://x.com/GavinSBaker/status/2082166566280642676 - arguing spot GPU rental rates at least 2x contracted rates imply hyperscaler underearning; hyperscale operating-cash-flow growth accelerating from roughly 31% (Q1 2026) toward 50% (Q2 2026) on his estimates; CY2028 capex of $1.5 to $2.2 trillion against $1.3 to $1.4 trillion of consensus operating cash flow; NVIDIA and Broadcom guarantees framed as credit “wrappers.” Cited exhibits include Wells Fargo hyperscaler CDS and leverage charts and the BofA hyperscaler-versus-semiconductor free-cash-flow series.
14. Author’s illustrative repricing model. Required capital recovery per GPU-hour: $30,000 H100 system-allocated, straight-lined over the amortization term, plus interest on a $12,000 average financed balance (80% advance), divided by utilized hours. The captive comparator deliberately uses a secured DDTL 5.0-class rate of roughly 8.8% - not CoreWeave’s 9.75% senior unsecured print, which is reported in the first essay for context but is not a like-for-like collateral rate. Captive: 4.5-year amortization (per Moody’s on DDTL 4.0), 55% utilization, 8.8% - 1.60perGPU-hourofrequiredcapitalrecovery.Isolatedrecoverysteps:financingcompressed250bpto6.3%(-0.06); amortization extended to seven years against the earning tail (-0.49);utilizationto75%viarouting(-0.28) - an illustrative liquid-market required recovery of $0.77. The $30,000 system-allocated basis and 55% captive utilization are chosen illustrative inputs, not sourced observations. One-variable useful-life sensitivity, holding financing (6.3%) and utilization (75%) constant: 5.5 years roughly $0.95, 7 years $0.77, 8 years roughly $0.69. Composite bear/bull cases that also vary financing and utilization together span roughly $1.11 to $0.61 and are labeled as composites, not life sensitivity. The economic condition behind any life extension is a crossover - the older machine’s lower acquisition cost and routing value must outweigh newer silicon’s power efficiency and performance for residual demand to exist. Cross-silicon competition is shown directionally only - it pressures the blended fleet and replacement cost that clears around the floor, but a market-clearing level would require a supply-and-demand model this note does not attempt. A no-life-extension case - the 4.5-year window with 250bp compression and 75% utilization - reaches only about $1.13, isolating the amortization window as the dominant term. The note 5 serving rate (300-400 tokens per second, trillion-parameter class) is a replica rate whose GPU count, batching, precision and concurrency the citation does not specify, so this note reports the ratio only: holding workload and throughput constant, replica configuration divides captive and portable recovery equally, leaving the roughly-half reduction in the capital-recovery component intact; no absolute dollars-per-million-tokens figure is claimed. The seven-year amortization is supported qualitatively by workload ossification: enterprises pin validated checkpoints for years, keeping older silicon in production service. CoreWeave’s 2026 A100 recontracting and DDTL 5.5 (note 2) provide qualitative evidence for residual demand and lender willingness to underwrite beyond an initial customer contract; neither validates the seven-year assumption or the $0.77 point estimate. Operator-level serving-efficiency variance - note 5 documents a roughly 10x gap between off-the-shelf and production serving on the same model class - is a separate software-execution effect and is deliberately not counted anywhere in this model. Gross of power, networking and operations; not a forecast.
Notes above give full source attributions. Figures indicative; floating tranches shown at approximate all-in rates.
